Statistici de bază
| Proprietari instituționali | 138 total, 117 long only, 0 short only, 21 long/short - change of -3,78% MRQ |
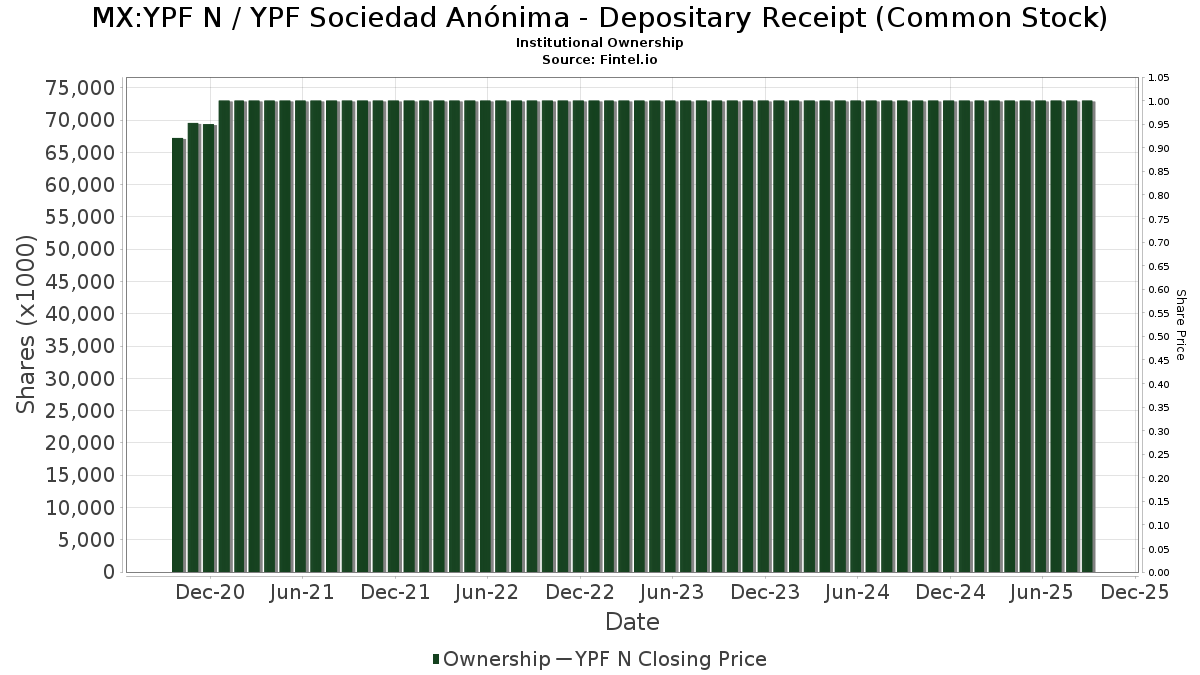
| Alocarea medie a portofoliului | 0.0820 % - change of -31,83% MRQ |
| Acțiuni instituționale (lung) | 36.522.267 (ex 13D/G) - change of 3,61MM shares 5,19% MRQ |
| Valoare instituțională (lungă) | $ 1.372.032 USD ($1000) |
Proprietatea instituțională și acționarii
YPF Sociedad Anónima - Depositary Receipt (Common Stock) (MX:YPF N) are 138 proprietarii instituționali și acționarii care au depus formulare 13D/G sau 13F la Securities Exchange Commission (SEC). Aceste instituții dețin un total de 36,522,267 acțiuni. Cei mai mari acționari includ Aquamarine Financial (Cayman) Ltd, Jpmorgan Chase & Co, North of South Capital LLP, VR Advisory Services Ltd, Susquehanna International Group, Llp, MIRAE ASSET GLOBAL ETFS HOLDINGS Ltd., Ping Capital Management, Inc., TT International Asset Management LTD, Morgan Stanley, and Jane Street Group, Llc .
YPF Sociedad Anónima - Depositary Receipt (Common Stock) (BMV:YPF N) Structura de proprietate instituțională arată pozițiile curente în companie în funcție de instituții și fonduri, precum și cele mai recente modificări ale dimensiunii poziției. Acţionarii majori pot include investitori individuali, fonduri mutuale, fonduri speculative sau instituţii. Anexa 13D indică faptul că investitorul deține (sau deține) mai mult de 5% din companie și intenționează (sau intenționează) să urmărească în mod activ o schimbare în strategia de afaceri. Schedule 13G indică o investiție pasivă de peste 5%.
Scorul de sentiment al fondului
Scorul de sentiment al fondului (fka Ownership Accumulation Score) găsește acțiunile care sunt cele mai cumpărate de fonduri. Este rezultatul unui model cantitativ sofisticat, multifactorial, care identifică companiile cu cele mai înalte niveluri de acumulare instituțională. Modelul de scoring utilizează o combinație între creșterea totală a proprietarilor dezvăluiți, modificările alocărilor de portofoliu în acești proprietari și alte valori. Numărul variază de la 0 la 100, numerele mai mari indicând un nivel mai ridicat de acumulare pentru semenii săi, iar 50 fiind media.
Frecvența actualizării: zilnic
Consultați Ownership Explorer, care oferă o listă a companiilor cu cel mai înalt rang.
AI+ Ask Fintel’s AI assistant about YPF Sociedad Anónima - Depositary Receipt (Common Stock).
Select a question to share a public post with an AI-crafted answer.
Thinking of good questions…
Depuneri 13F și NPORT
Detaliile privind depunerile 13F sunt gratuite. Detaliile privind depunerea NP necesită un abonament premium. Rândurile verzi indică poziții noi. Rândurile roșii indică poziții închise. Dă click pe link pictograma pentru a vedea istoricul complet al tranzacțiilor.
Actualizare
pentru a debloca date premium și a exporta în Excel ![]() .
.
| Data fișierului | Sursă | Investitor | Tip | Preț mediu (Est) |
Acțiuni | Δ Acțiuni (%) |
Raportat Valoare (1000 USD) |
Valoarea Δ (%) |
Port Alloc (%) |
|
|---|---|---|---|---|---|---|---|---|---|---|
| 2026-04-30 | 13F | Channing Global Advisors, Llc | 53 | 2 | ||||||
| 2026-01-16 | 13F | Compagnie Lombard Odier SCmA | 0 | -100,00 | 0 | -100,00 | ||||
| 2026-04-22 | 13F | Quattro Financial Advisors Llc | 25.000 | -50,00 | 1.156 | -36,12 | ||||
| 2026-02-13 | 13F | Banco Santander, S.A. | 139.784 | 216,05 | 5.055 | 370,58 | ||||
| 2026-02-17 | 13F | Boothbay Fund Management, Llc | 0 | -100,00 | 0 | |||||
| 2026-02-17 | 13F | Engineers Gate Manager LP | 0 | -100,00 | 0 | |||||
| 2026-01-28 | 13F | Kapitalo Investimentos Ltda | 257.042 | -0,22 | 9.295 | 48,54 | ||||
| 2026-02-06 | 13F | Pnc Financial Services Group, Inc. | 550 | -2,48 | 20 | 46,15 | ||||
| 2026-02-17 | 13F | DZ BANK AG Deutsche Zentral Genossenschafts Bank, Frankfurt am Main | 66.000 | 2.387 | ||||||
| 2026-02-17 | 13F | Raymond James Financial Inc | 10.248 | 371 | ||||||
| 2026-02-17 | 13F | Schonfeld Strategic Advisors LLC | 0 | -100,00 | 0 | |||||
| 2026-01-22 | 13F | Trium Capital LLP | Call | 0 | -100,00 | 0 | ||||
| 2026-02-13 | 13F | Van Eck Associates Corp | 19.430 | 153,56 | 1 | |||||
| 2026-04-20 | 13F | Sowell Financial Services LLC | 6.711 | -4,31 | 310 | 22,53 | ||||
| 2026-05-01 | 13F | Hantz Financial Services, Inc. | 9.060 | 22,53 | 0 | |||||
| 2026-04-16 | 13F | SG Americas Securities, LLC | 0 | -100,00 | 0 | |||||
| 2026-04-15 | 13F | Activest Wealth Management | 47.608 | -1,52 | 2.200 | 25,86 | ||||
| 2026-02-06 | 13F | Larson Financial Group LLC | 8 | 0 | ||||||
| 2026-02-13 | 13F | Wells Fargo & Company/mn | 45.644 | 2.710,59 | 1.650 | 4.130,77 | ||||
| 2026-04-06 | 13F | Highline Wealth Partners Llc | 159 | 0,00 | 7 | 40,00 | ||||
| 2026-02-10 | 13F | Globeflex Capital L P | 221.544 | -13,83 | 8.011 | 28,28 | ||||
| 2025-11-04 | 13F | Core Wealth Partners LLC | 0 | -100,00 | 0 | |||||
| 2026-02-04 | 13F | Paradigm Asset Management Co Llc | 10.692 | 0,00 | 387 | 49,03 | ||||
| 2026-02-17 | 13F | VR Advisory Services Ltd | 3.231.396 | -10,38 | 116.847 | 33,42 | ||||
| 2025-11-06 | 13F | Leuthold Group, Llc | 0 | -100,00 | 0 | -100,00 | ||||
| 2025-11-10 | 13F | Beverly Hills Private Wealth, LLC | 0 | -100,00 | 0 | -100,00 | ||||
| 2025-11-14 | 13F | Integrated Wealth Concepts LLC | 0 | -100,00 | 0 | -100,00 | ||||
| 2025-11-14 | 13F | Credit Agricole S A | 0 | -100,00 | 0 | -100,00 | ||||
| 2025-11-05 | 13F | AdvisorShares Investments LLC | 0 | -100,00 | 0 | |||||
| 2026-01-20 | 13F | Wall Street Access Asset Management, LLC | 75 | 0,00 | 3 | 100,00 | ||||
| 2025-11-13 | 13F | Parallel Advisors, LLC | 0 | -100,00 | 0 | |||||
| 2026-04-20 | 13F | Ronald Blue Trust, Inc. | 1.139 | 0,00 | 53 | 26,83 | ||||
| 2026-04-24 | 13F | Profund Advisors Llc | 8.784 | 406 | ||||||
| 2026-04-28 | 13F | Altfest L J & Co Inc | 21.207 | 980 | ||||||
| 2026-02-17 | 13F | Masters Capital Management Llc | Call | 620.000 | 22.419 | |||||
| 2026-02-19 | 13F | Invesco Ltd. | 0 | -100,00 | 0 | |||||
| 2026-02-12 | 13F | Principal Securities, Inc. | 0 | -100,00 | 0 | |||||
| 2026-01-14 | 13F | ORG Partners LLC | 275 | -15,38 | 10 | 28,57 | ||||
| 2026-02-17 | 13F | Murchinson Ltd. | 0 | -100,00 | 0 | |||||
| 2026-02-17 | 13F | Point72 Asset Management, L.P. | Call | 382.800 | 430,93 | 13.842 | 690,52 | |||
| 2026-04-22 | 13F | Stone House Investment Management, LLC | 8 | 0 | ||||||
| 2026-02-17 | 13F | Parallax Volatility Advisers, L.P. | Call | 0 | -100,00 | 0 | ||||
| 2026-04-13 | 13F | IFP Advisors, Inc | 1.100 | 0,00 | 51 | 28,21 | ||||
| 2025-11-07 | 13F | Gf Fund Management Co. Ltd. | 0 | -100,00 | 0 | |||||
| 2026-02-17 | 13F | Point72 Asset Management, L.P. | Put | 43.200 | 1.562 | |||||
| 2025-11-13 | 13F | Capital Wealth Planning, LLC | 0 | -100,00 | 0 | -100,00 | ||||
| 2025-11-14 | 13F/A | NorthRock Partners, LLC | 0 | -100,00 | 0 | -100,00 | ||||
| 2026-04-30 | 13F | Nisa Investment Advisors, Llc | 4 | 0 | ||||||
| 2026-04-24 | 13F | TT International Asset Management LTD | 1.289.597 | 4.896,69 | 59.605 | |||||
| 2026-01-27 | 13F | TD Waterhouse Canada Inc. | 2 | 0,00 | 0 | |||||
| 2026-02-13 | 13F/A | Alberta Investment Management Corp | 0 | -100,00 | 0 | |||||
| 2026-05-01 | 13F | Diversify Wealth Management, Llc | 5.772 | 259 | ||||||
| 2025-11-14 | 13F | Eqis Capital Management, Inc. | 0 | -100,00 | 0 | |||||
| 2025-11-14 | 13F | Scientech Research LLC | 0 | -100,00 | 0 | -100,00 | ||||
| 2026-04-20 | 13F | North of South Capital LLP | 3.524.252 | 110,99 | 162.891 | 169,69 | ||||
| 2026-02-17 | 13F | Russell Investments Group, Ltd. | 453.795 | -2,57 | 16.409 | 45,05 | ||||
| 2026-04-24 | 13F | Mason Hill Advisors Llc | 467.000 | 21.585 | ||||||
| 2026-02-13 | 13F | Squarepoint Ops LLC | 0 | -100,00 | 0 | -100,00 | ||||
| 2026-02-17 | 13F | MIRAE ASSET GLOBAL ETFS HOLDINGS Ltd. | 1.663.818 | -37,23 | 60.164 | -6,55 | ||||
| 2026-02-11 | 13F | Simplex Trading, Llc | 26.752 | -34,53 | 967 | |||||
| 2026-02-11 | 13F | Simplex Trading, Llc | Call | 158.900 | -27,87 | 5.746 | 114.800,00 | |||
| 2025-11-14 | 13F | Wolverine Trading, Llc | 9.748 | -40,89 | 247 | -55,01 | ||||
| 2026-02-17 | 13F | State Of Wisconsin Investment Board | 56.276 | 2.035 | ||||||
| 2025-11-14 | 13F | Wolverine Trading, Llc | Call | 13.100 | -49,42 | 332 | -61,53 | |||
| 2026-02-11 | 13F | Simplex Trading, Llc | Put | 135.700 | -26,45 | 4.907 | 122.550,00 | |||
| 2025-11-14 | 13F | Wolverine Trading, Llc | Put | 12.400 | -51,37 | 314 | -63,02 | |||
| 2025-11-12 | 13F | William Blair Investment Management, Llc | 0 | -100,00 | 0 | -100,00 | ||||
| 2026-04-14 | 13F | Prospera Financial Services Inc | 46.761 | 2.161 | ||||||
| 2026-02-13 | 13F | Citigroup Inc | 55.923 | -8,73 | 2.022 | 35,89 | ||||
| 2026-02-17 | 13F | Susquehanna International Group, Llp | Call | 1.727.300 | 0,70 | 62.459 | 49,91 | |||
| 2026-02-17 | 13F | Susquehanna International Group, Llp | 60.330 | -78,04 | 2.182 | -67,32 | ||||
| 2026-02-13 | 13F | Toroso Investments, LLC | 12.955 | 468 | ||||||
| 2026-02-17 | 13F | Susquehanna International Group, Llp | Put | 1.137.000 | 4,16 | 41.114 | 55,06 | |||
| 2026-02-11 | 13F | LPL Financial LLC | 58.171 | 2,38 | 2.103 | 52,39 | ||||
| 2026-04-27 | 13F | Leonteq Securities AG | 6.741 | -70,59 | 312 | -62,44 | ||||
| 2026-02-13 | 13F | Stifel Financial Corp | 53.608 | -65,35 | 1.938 | -48,43 | ||||
| 2025-11-14 | 13F | XTX Topco Ltd | 0 | -100,00 | 0 | -100,00 | ||||
| 2026-02-17 | 13F | Royal Bank Of Canada | 5.760 | 20,75 | 208 | 79,31 | ||||
| 2026-02-12 | 13F | BlackRock, Inc. | 332 | 0,00 | 12 | 50,00 | ||||
| 2025-11-07 | 13F | Fiera Capital Corp | 0 | -100,00 | 0 | -100,00 | ||||
| 2025-11-14 | 13F | Aquatic Capital Management LLC | 0 | -100,00 | 0 | -100,00 | ||||
| 2026-02-17 | 13F | Two Sigma Investments, Lp | Put | 46.200 | 1.671 | |||||
| 2026-02-17 | 13F | Two Sigma Investments, Lp | Call | 43.100 | 1.558 | |||||
| 2026-02-17 | 13F | Brevan Howard Capital Management LP | 202.258 | 258,44 | 7.313 | 433,72 | ||||
| 2026-04-07 | 13F | Farther Finance Advisors, LLC | 690 | 62,35 | 31 | 100,00 | ||||
| 2026-02-17 | 13F | Grantham, Mayo, Van Otterloo & Co. LLC | 1.145.878 | -16,70 | 41.435 | 24,01 | ||||
| 2025-11-06 | 13F | Atria Investments Llc | 0 | -100,00 | 0 | -100,00 | ||||
| 2026-02-10 | 13F | Bnp Paribas Arbitrage, Sa | 72.000 | -65,88 | 2.604 | -49,21 | ||||
| 2026-02-19 | 13F | First Growth Capital LLC | 18.338 | 715 | ||||||
| 2026-04-09 | 13F | Crocodile Capital Partners GmbH | 0 | -100,00 | 0 | |||||
| 2025-11-13 | 13F | Diversify Advisory Services, LLC | 0 | -100,00 | 0 | -100,00 | ||||
| 2026-02-17 | 13F | Snowden Capital Advisors LLC | 15.388 | 556 | ||||||
| 2026-03-19 | 13F | Painted Porch Advisors LLC | 0 | -100,00 | 0 | |||||
| 2026-02-17 | 13F | Sig Brokerage, Lp | 34.419 | 178,83 | 1.245 | 316,05 | ||||
| 2025-11-14 | 13F | Oaktree Fund Advisors, LLC | 0 | -100,00 | 0 | -100,00 | ||||
| 2026-02-17 | 13F/A | Laurion Capital Management LP | 12.000 | 0,00 | 434 | 48,80 | ||||
| 2026-02-06 | 13F | HighTower Advisors, LLC | 8.523 | 3,33 | 308 | 54,00 | ||||
| 2026-02-17 | 13F | Point72 Asset Management, L.P. | 0 | -100,00 | 0 | |||||
| 2026-01-26 | 13F | Cwm, Llc | 0 | -100,00 | 0 | |||||
| 2026-02-17 | 13F | Tower Research Capital LLC (TRC) | 0 | -100,00 | 0 | |||||
| 2026-02-13 | 13F | Caitong International Asset Management Co., Ltd | 0 | -100,00 | 0 | |||||
| 2025-11-18 | 13F | Dorsey Wright & Associates | 0 | -100,00 | 0 | |||||
| 2026-02-13 | 13F | Sofos Investments, Inc. | 1 | -95,00 | 0 | |||||
| 2026-01-30 | 13F | Pekin Hardy Strauss, Inc. | 10.750 | 389 | ||||||
| 2026-02-12 | 13F | Insigneo Advisory Services, Llc | 64.924 | -71,86 | 2.348 | -58,13 | ||||
| 2026-02-13 | 13F | MAI Capital Management | 300 | 0,00 | 11 | 42,86 | ||||
| 2025-11-13 | 13F | Oaktree Capital Management Lp | 0 | -100,00 | 0 | -100,00 | ||||
| 2025-11-12 | 13F | Ci Investments Inc. | 0 | -100,00 | 0 | -100,00 | ||||
| 2026-01-23 | 13F | Assetmark, Inc | 33 | 0,00 | 1 | |||||
| 2026-02-17 | 13F | Private Advisor Group, LLC | 0 | -100,00 | 0 | |||||
| 2025-11-05 | 13F | Envestnet Asset Management Inc | 0 | -100,00 | 0 | -100,00 | ||||
| 2026-02-10 | 13F | Fort Sheridan Advisors Llc | 23.975 | 0,00 | 867 | 48,80 | ||||
| 2026-02-13 | 13F | Aigen Investment Management, Lp | 0 | -100,00 | 0 | |||||
| 2025-11-10 | 13F | Wrapmanager Inc | 0 | -100,00 | 0 | -100,00 | ||||
| 2026-02-12 | 13F | Wealthspire Advisors, LLC | 0 | -100,00 | 0 | |||||
| 2026-04-24 | 13F | Deltec Asset Management Llc | 40.750 | -30,04 | 1.883 | -10,59 | ||||
| 2026-02-17 | 13F | Caption Management, LLC | Put | 70.000 | 0,00 | 2.531 | 48,88 | |||
| 2026-02-17 | 13F | Caption Management, LLC | Call | 250.000 | 9.040 | |||||
| 2026-01-26 | 13F | Mirae Asset Global Investments Co., Ltd. | 3.642 | 6,06 | 132 | 57,83 | ||||
| 2026-02-11 | 13F | Group One Trading, L.p. | Put | 733.500 | -1,34 | 26.523 | 46,87 | |||
| 2026-04-27 | 13F | Truist Financial Corp | 5.408 | 250 | ||||||
| 2026-02-11 | 13F | Group One Trading, L.p. | 211.359 | -47,89 | 7.643 | -22,42 | ||||
| 2026-02-11 | 13F | Group One Trading, L.p. | Call | 398.100 | -17,70 | 14.395 | 22,52 | |||
| 2026-01-29 | 13F | IMC-Chicago, LLC | 0 | -100,00 | 0 | -100,00 | ||||
| 2025-11-14 | 13F | Virtu Financial LLC | 0 | -100,00 | 0 | -100,00 | ||||
| 2026-02-13 | 13F | Walleye Trading LLC | 32.235 | 16,07 | 1.166 | 72,85 | ||||
| 2026-02-13 | 13F | Walleye Trading LLC | Put | 127.700 | -38,96 | 4.618 | -9,13 | |||
| 2026-02-13 | 13F | Walleye Trading LLC | Call | 48.700 | -85,89 | 1.761 | -79,01 | |||
| 2026-02-17 | 13F | Bank Of America Corp /de/ | 216.422 | -34,55 | 7.826 | -2,58 | ||||
| 2026-02-17 | 13F | Voloridge Investment Management, Llc | 0 | -100,00 | 0 | |||||
| 2026-02-17 | 13F | Tudor Investment Corp Et Al | Call | 95.500 | 89,48 | 3.453 | 182,11 | |||
| 2025-11-14 | 13F | Axa S.a. | 0 | -100,00 | 0 | |||||
| 2026-02-17 | 13F | Tudor Investment Corp Et Al | Put | 96.400 | 44,31 | 3.486 | 114,86 | |||
| 2026-04-27 | 13F | RWC Asset Management LLP | 77.205 | 28,12 | 3.568 | 63,74 | ||||
| 2026-02-09 | 13F | Huntington National Bank | 1 | 0,00 | 0 | |||||
| 2026-03-12 | 13F/A | Peak6 Llc | 0 | -100,00 | 0 | -100,00 | ||||
| 2025-11-14 | 13F | Cubist Systematic Strategies, LLC | Call | 87.100 | -55,63 | 2.116 | -65,74 | |||
| 2026-01-07 | 13F | Qp Wealth Management, Llc | 0 | -100,00 | 0 | |||||
| 2026-02-13 | 13F | Verition Fund Management LLC | 147.000 | 120,69 | 5.316 | 228,70 | ||||
| 2025-11-14 | 13F | Cubist Systematic Strategies, LLC | Put | 42.300 | -56,17 | 1.027 | -66,15 | |||
| 2026-04-28 | 13F | LWM Advisory Services, LLC | 9.579 | 0,00 | 443 | 27,75 | ||||
| 2026-04-20 | 13F | Assenagon Asset Management S.A. | 59.486 | 2.749 | ||||||
| 2026-02-17 | 13F | Jones Financial Companies Lllp | 74 | 5,71 | 3 | 100,00 | ||||
| 2026-02-12 | 13F | Jane Street Group, Llc | Call | 163.000 | -3,83 | 5.894 | 43,16 | |||
| 2025-11-07 | 13F | Gsa Capital Partners Llp | 0 | -100,00 | 0 | |||||
| 2026-02-12 | 13F | Jane Street Group, Llc | Put | 1.238.000 | 41,97 | 44.766 | 111,36 | |||
| 2026-02-12 | 13F | Jane Street Group, Llc | 156.562 | -31,39 | 5.661 | 2,15 | ||||
| 2026-02-12 | 13F | Marex Group plc | 9.702 | 5,69 | 351 | 57,66 | ||||
| 2026-02-12 | 13F | Barometer Capital Management Inc. | 0 | -100,00 | 0 | |||||
| 2026-04-15 | 13F | Steadtrust LLC | 20.000 | -9,09 | 924 | 16,23 | ||||
| 2026-04-30 | 13F | Kestra Advisory Services, LLC | 0 | -100,00 | 0 | |||||
| 2026-02-17 | 13F | Millennium Management Llc | Call | 0 | -100,00 | 0 | ||||
| 2025-11-14 | 13F | D. E. Shaw & Co., Inc. | 0 | -100,00 | 0 | -100,00 | ||||
| 2026-02-13 | 13F | Morgan Stanley | 1.265.812 | 8,37 | 45.772 | 61,34 | ||||
| 2026-02-17 | 13F | Citadel Advisors Llc | Call | 421.700 | -45,48 | 15.249 | -18,84 | |||
| 2026-02-17 | 13F | Capital Fund Management S.a. | Call | 81.900 | -65,16 | 2.962 | -48,14 | |||
| 2026-01-30 | 13F | Glenorchy Capital Ltd | 113.532 | -5,62 | 4.105 | 40,53 | ||||
| 2026-02-17 | 13F | Citadel Advisors Llc | Put | 749.300 | -14,64 | 27.095 | 27,08 | |||
| 2025-11-14 | 13F | Balyasny Asset Management Llc | Call | 0 | -100,00 | 0 | -100,00 | |||
| 2026-04-27 | 13F | Ping Capital Management, Inc. | 1.378.200 | -29,28 | 63.700 | -9,60 | ||||
| 2026-02-17 | 13F | Citadel Advisors Llc | 593.812 | -1,20 | 21.472 | 47,08 | ||||
| 2026-02-17 | 13F | Capital Fund Management S.a. | Put | 80.800 | -62,33 | 2.922 | -43,93 | |||
| 2026-02-13 | 13F | Walleye Capital LLC | Call | 35.700 | 310,34 | 1.291 | 511,37 | |||
| 2026-04-16 | 13F | Vaughan Nelson Investment Management, L.p. | 245.687 | -6,36 | 11.356 | 19,69 | ||||
| 2026-02-13 | 13F | Walleye Capital LLC | Put | 96.300 | 423,37 | 3.482 | 680,72 | |||
| 2026-02-17 | 13F | Parallax Volatility Advisers, L.P. | 6.936 | -91,12 | 251 | -86,83 | ||||
| 2026-02-13 | 13F | Walleye Capital LLC | 45.992 | 271,14 | 1.663 | 452,49 | ||||
| 2026-02-17 | 13F | Parallax Volatility Advisers, L.P. | Put | 75.000 | -11,76 | 2.712 | 31,40 | |||
| 2026-02-17 | 13F | Nomura Holdings Inc | 57.647 | 2.085 | ||||||
| 2026-04-29 | 13F | Skopos Labs, Inc. | 13.057 | 63,72 | 603 | 107,93 | ||||
| 2026-04-08 | 13F | Systrade AG | 0 | -100,00 | 0 | |||||
| 2026-02-06 | 13F | EverSource Wealth Advisors, LLC | 1.384 | -43,99 | 50 | -16,67 | ||||
| 2026-02-10 | 13F | Titan Global Capital Management Usa Llc | 23.330 | 20,07 | 844 | 78,98 | ||||
| 2026-02-13 | 13F | Wexford Capital Lp | 128.693 | 4.654 | ||||||
| 2026-02-17 | 13F | BlueCrest Capital Management Ltd | 43.500 | 1.573 | ||||||
| 2026-02-17 | 13F | D. E. Shaw & Co., Inc. | Call | 44.300 | 60,51 | 1.602 | 138,96 | |||
| 2026-02-17 | 13F | Northern Trust Corp | 11.092 | 10,07 | 401 | 64,34 | ||||
| 2025-11-10 | 13F | Personal Cfo Solutions, Llc | 0 | -100,00 | 0 | |||||
| 2026-04-30 | 13F | Candriam Luxembourg S.C.A. | 444.000 | 202,04 | 20.522 | 286,10 | ||||
| 2026-02-20 | 13F | Sunbelt Securities, Inc. | 1.353 | 0,00 | 49 | 50,00 | ||||
| 2026-04-24 | 13F | UMA Financial Services, Inc. | 2 | 0,00 | 0 | |||||
| 2026-02-13 | 13F | Rhumbline Advisers | 4.385 | -49,42 | 159 | -24,76 | ||||
| 2026-02-13 | 13F | Squarepoint Ops LLC | Call | 41.200 | 5,64 | 1.490 | 57,23 | |||
| 2026-02-13 | 13F | Squarepoint Ops LLC | Put | 18.100 | -75,67 | 654 | -63,81 | |||
| 2026-02-17 | 13F | Discovery Capital Management, Llc / Ct | 270.100 | 9.767 | ||||||
| 2026-02-17 | 13F | FIL Ltd | 0 | -100,00 | 0 | |||||
| 2026-04-03 | 13F | Investors Research Corp | 0 | -100,00 | 0 | |||||
| 2026-04-06 | 13F | GAMMA Investing LLC | 1.711 | 8,98 | 79 | 41,07 | ||||
| 2026-02-17 | 13F | Cetera Investment Advisers | 32.999 | -0,04 | 1.193 | 48,94 | ||||
| 2026-02-17 | 13F | Perritt Capital Management Inc | 0 | -100,00 | 0 | |||||
| 2026-02-17 | 13F | Caption Management, LLC | 0 | -100,00 | 0 | |||||
| 2026-02-13 | 13F | Atlas Capital Advisors Llc | 10.735 | 0,79 | 388 | 16,17 | ||||
| 2026-04-15 | 13F | Bayforest Capital Ltd | 4.393 | 169,51 | 203 | 250,00 | ||||
| 2026-02-11 | 13F | Jpmorgan Chase & Co | 3.737.690 | -12,92 | 135.155 | 29,63 | ||||
| 2026-02-13 | 13F | Smartleaf Asset Management LLC | 51 | 2 | ||||||
| 2026-02-06 | 13F | Global Retirement Partners, LLC | 81 | 0,00 | 3 | 100,00 | ||||
| 2026-02-17 | 13F | Graham Capital Management, L.P. | 35.379 | -29,23 | 1.279 | 5,35 | ||||
| 2026-05-01 | 13F | Rakuten Securities, Inc. | 1.355 | -47,84 | 63 | -33,33 | ||||
| 2026-02-17 | 13F | D. E. Shaw & Co., Inc. | Put | 91.200 | -26,86 | 3.298 | 8,88 | |||
| 2026-04-28 | 13F | Golden State Equity Partners | 201 | 9 | ||||||
| 2026-02-17 | 13F | GAM Holding AG | 0 | -100,00 | 0 | |||||
| 2026-03-12 | 13F/A | Peak6 Llc | Put | 224.200 | -33,71 | 8.107 | -1,30 | |||
| 2026-03-12 | 13F/A | Peak6 Llc | Call | 92.700 | 713,16 | 3.352 | 1.114,49 | |||
| 2026-04-20 | 13F | First PREMIER Bank | 100 | 0 | ||||||
| 2026-02-17 | 13F | Fmr Llc | 90 | -27,42 | 3 | 0,00 | ||||
| 2026-02-17 | 13F | Rwc Asset Advisors (us) Llc | 0 | -100,00 | 0 | |||||
| 2026-02-17 | 13F | Alpine Global Management, LLC | 204.000 | 7.377 | ||||||
| 2026-01-08 | 13F | Chesapeake Asset Management Llc | 26.880 | 0,00 | 972 | 48,93 | ||||
| 2025-11-14 | 13F | Centiva Capital, LP | 0 | -100,00 | 0 | -100,00 | ||||
| 2026-02-02 | 13F | Mutual Advisors, LLC | 7.161 | -6,20 | 259 | 25,85 | ||||
| 2026-02-17 | 13F | Nwi Management Lp | Call | 500.400 | 0,00 | 18 | 50,00 | |||
| 2025-11-14 | 13F | Two Sigma Investments, Lp | 0 | -100,00 | 0 | -100,00 | ||||
| 2026-02-17 | 13F | Nwi Management Lp | 226.475 | -79,03 | 8 | -69,23 | ||||
| 2026-02-10 | 13F | Goldman Sachs Group Inc | 442.640 | 76,85 | 16.006 | 163,28 | ||||
| 2026-02-17 | 13F | Millennium Management Llc | 149.910 | -52,85 | 5.421 | -29,81 | ||||
| 2026-04-28 | 13F | DGS Capital Management, LLC | 5.131 | 237 | ||||||
| 2025-11-25 | 13F | Briaud Financial Planning, Inc | 0 | -100,00 | 0 | |||||
| 2026-04-27 | 13F | Y-Intercept (Hong Kong) Ltd | 140.884 | 6.512 | ||||||
| 2026-02-12 | 13F | Federation des caisses Desjardins du Quebec | 500 | 0,00 | 18 | 50,00 | ||||
| 2026-02-17 | 13F | Millennium Management Llc | Put | 67.500 | -55,80 | 2.441 | -34,21 | |||
| 2026-02-10 | 13F | BW Gestao de Investimentos Ltda. | 0 | -100,00 | 0 | |||||
| 2026-02-17 | 13F | Amundi | 85.574 | 31,67 | 3.094 | 93,38 | ||||
| 2026-02-11 | 13F | TruNorth Capital Management, LLC | 0 | -100,00 | 0 | |||||
| 2026-02-17 | 13F | ExodusPoint Capital Management, LP | 0 | -100,00 | 0 | -100,00 | ||||
| 2026-04-23 | 13F | Global Trust Asset Management, LLC | 0 | -100,00 | 0 | |||||
| 2026-04-30 | 13F | Hsbc Holdings Plc | 277.591 | -7,30 | 13.199 | 22,31 | ||||
| 2026-02-17 | 13F | Tudor Investment Corp Et Al | 0 | -100,00 | 0 | -100,00 | ||||
| 2025-11-12 | 13F | Polen Capital Management Llc | 0 | -100,00 | 0 | |||||
| 2026-02-17 | 13F | SageView Advisory Group, LLC | 227 | 8 | ||||||
| 2026-02-13 | 13F | Mariner, LLC | 17.747 | 114,47 | 642 | 218,91 | ||||
| 2026-01-07 | 13F | Aventura Private Wealth, LLC | 145 | 5 | ||||||
| 2026-04-07 | 13F | CoreCap Advisors, LLC | 3.400 | 157 | ||||||
| 2026-01-28 | 13F | Aquamarine Financial (Cayman) Ltd | 10.492.557 | -19,12 | 379.411 | 20,40 | ||||
| 2026-02-13 | 13F | SRS Capital Advisors, Inc. | 100 | 0,00 | 4 | 50,00 | ||||
| 2025-11-13 | 13F | Banco BTG Pactual S.A. | 0 | -100,00 | 0 | |||||
| 2026-01-29 | 13F | IMC-Chicago, LLC | Put | 144.100 | -5,57 | 5.211 | 40,58 | |||
| 2026-01-29 | 13F | IMC-Chicago, LLC | Call | 262.200 | 14,35 | 9.481 | 70,25 | |||
| 2026-02-10 | 13F | Monaco Asset Management SAM | 0 | -100,00 | 0 | -100,00 | ||||
| 2025-11-14 | 13F | Cubist Systematic Strategies, LLC | 0 | -100,00 | 0 | -100,00 | ||||
| 2026-02-13 | 13F | Barclays Plc | Put | 30.000 | -50,00 | 1.085 | -25,60 | |||
| 2026-04-15 | 13F | FNY Investment Advisers, LLC | 259 | 0 | ||||||
| 2026-02-13 | 13F | Barclays Plc | 111.030 | -29,93 | 4.015 | 4,29 | ||||
| 2026-02-17 | 13F | Advisor Group Holdings, Inc. | 3.649 | -75,63 | 132 | -70,89 | ||||
| 2026-02-17 | 13F | Duquesne Family Office LLC | 606.990 | 429,22 | 22 | 950,00 | ||||
| 2026-01-29 | 13F | UBS Group AG | Call | 110.100 | 3.981 | |||||
| 2026-01-29 | 13F | UBS Group AG | 726.102 | 11,47 | 26.256 | 65,94 |