Statistici de bază
| Acțiuni instituționale (lung) | 223.269.576 - 73,14% (ex 13D/G) - change of -30,84MM shares -12,04% MRQ |
| Valoare instituțională (lungă) | $ 1.733.552 USD ($1000) |
Proprietatea instituțională și acționarii
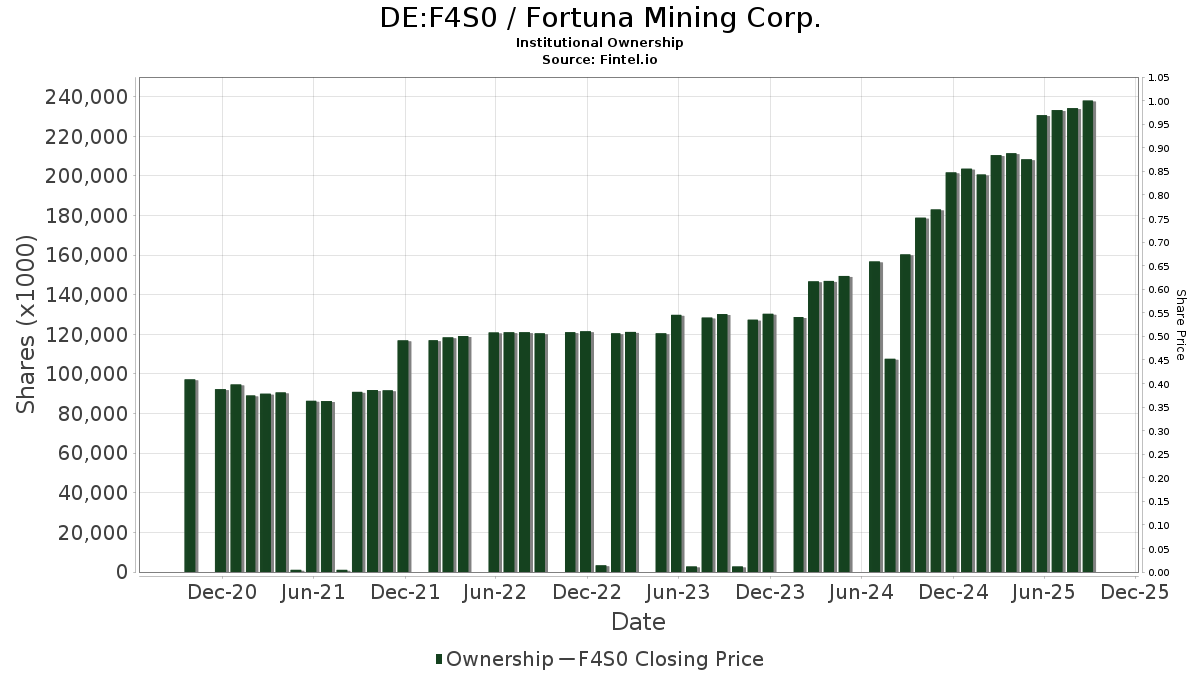
Fortuna Mining Corp. (DE:F4S0) are 254 proprietarii instituționali și acționarii care au depus formulare 13D/G sau 13F la Securities Exchange Commission (SEC). Aceste instituții dețin un total de 223,336,332 acțiuni. Cei mai mari acționari includ Van Eck Associates Corp, Arrowstreet Capital, Limited Partnership, MIRAE ASSET GLOBAL ETFS HOLDINGS Ltd., Acadian Asset Management Llc, Dimensional Fund Advisors Lp, Toroso Investments, LLC, SIL - Global X Silver Miners ETF, Morgan Stanley, American Century Companies Inc, and Vanguard Group Inc .
Fortuna Mining Corp. (DB:F4S0) Structura de proprietate instituțională arată pozițiile curente în companie în funcție de instituții și fonduri, precum și cele mai recente modificări ale dimensiunii poziției. Acţionarii majori pot include investitori individuali, fonduri mutuale, fonduri speculative sau instituţii. Anexa 13D indică faptul că investitorul deține (sau deține) mai mult de 5% din companie și intenționează (sau intenționează) să urmărească în mod activ o schimbare în strategia de afaceri. Schedule 13G indică o investiție pasivă de peste 5%.
Scorul de sentiment al fondului
Scorul de sentiment al fondului (fka Ownership Accumulation Score) găsește acțiunile care sunt cele mai cumpărate de fonduri. Este rezultatul unui model cantitativ sofisticat, multifactorial, care identifică companiile cu cele mai înalte niveluri de acumulare instituțională. Modelul de scoring utilizează o combinație între creșterea totală a proprietarilor dezvăluiți, modificările alocărilor de portofoliu în acești proprietari și alte valori. Numărul variază de la 0 la 100, numerele mai mari indicând un nivel mai ridicat de acumulare pentru semenii săi, iar 50 fiind media.
Frecvența actualizării: zilnic
Consultați Ownership Explorer, care oferă o listă a companiilor cu cel mai înalt rang.
AI+ Ask Fintel’s AI assistant about Fortuna Mining Corp..
Select a question to share a public post with an AI-crafted answer.
Thinking of good questions…
Depuneri 13F și NPORT
Detaliile privind depunerile 13F sunt gratuite. Detaliile privind depunerea NP necesită un abonament premium. Rândurile verzi indică poziții noi. Rândurile roșii indică poziții închise. Dă click pe link pictograma pentru a vedea istoricul complet al tranzacțiilor.
Actualizare
pentru a debloca date premium și a exporta în Excel ![]() .
.
| Data fișierului | Sursă | Investitor | Tip | Preț mediu (Est) |
Acțiuni | Δ Acțiuni (%) |
Raportat Valoare (1000 USD) |
Valoarea Δ (%) |
Port Alloc (%) |
|
|---|---|---|---|---|---|---|---|---|---|---|
| 2026-02-11 | 13F | Deutsche Bank Ag\ | 1.243.414 | 28,70 | 12.198 | 40,91 | ||||
| 2026-02-17 | 13F | Balyasny Asset Management Llc | 721.721 | 52,89 | 7.080 | 67,42 | ||||
| 2026-02-11 | 13F | Picton Mahoney Asset Management | 157.668 | -27,95 | 1.547 | 154.600,00 | ||||
| 2026-02-11 | 13F | Jpmorgan Chase & Co | 144.772 | -69,57 | 1.420 | -66,69 | ||||
| 2026-02-13 | 13F | Global Strategic Management Inc | 941.349 | 9 | ||||||
| 2026-02-10 | 13F | Jupiter Asset Management Ltd | 231.361 | 276,61 | 2.270 | 312,73 | ||||
| 2026-02-12 | 13F | Aristides Capital LLC | 0 | -100,00 | 0 | |||||
| 2026-02-13 | 13F | Van Eck Associates Corp | 24.185.050 | -17,40 | 237 | -9,54 | ||||
| 2026-02-13 | 13F | Walleye Capital LLC | Put | 126.900 | 111,85 | 1.245 | 132,09 | |||
| 2026-02-13 | 13F | Walleye Capital LLC | Call | 91.300 | 271,14 | 896 | 306,82 | |||
| 2026-02-13 | 13F | Charles Schwab Investment Management Inc | 655.431 | 42,04 | 6.431 | 55,64 | ||||
| 2026-02-02 | 13F | Intact Investment Management Inc. | 126.400 | 1.239 | ||||||
| 2026-02-05 | 13F | Allworth Financial LP | 3.500 | 0,00 | 34 | 9,68 | ||||
| 2025-09-26 | NP | EPGFX - EuroPac Gold Fund Class A | 3.584.980 | 0,00 | 23.123 | 3,20 | ||||
| 2025-10-07 | 13F | Quintet Private Bank (Europe) S.A. | 0 | -100,00 | 0 | -100,00 | ||||
| 2026-02-17 | 13F | Guggenheim Capital Llc | 409.728 | 2,39 | 4.019 | 12,11 | ||||
| 2026-02-12 | 13F | Campbell & CO Investment Adviser LLC | 221.566 | 15,80 | 2.174 | 26,78 | ||||
| 2026-02-13 | 13F | Ingalls & Snyder Llc | 27.500 | 0,00 | 0 | |||||
| 2026-02-17 | 13F | Man Group plc | 783.022 | 192,48 | 7.681 | 220,31 | ||||
| 2025-11-14 | 13F | Luminist Capital LLC | 0 | -100,00 | 0 | |||||
| 2026-02-11 | 13F | Hughes Financial Services, LLC | 60 | 0,00 | 1 | |||||
| 2026-02-13 | 13F | National Bank Of Canada /fi/ | 506.332 | -57,65 | 4.959 | -53,38 | ||||
| 2026-01-09 | 13F | Pacifica Partners Inc. | 880 | 0,00 | 8 | 14,29 | ||||
| 2025-10-16 | 13F | Ronald Blue Trust, Inc. | 0 | -100,00 | 0 | -100,00 | ||||
| 2026-02-13 | 13F | MAI Capital Management | 482 | 0,00 | 5 | 0,00 | ||||
| 2026-02-12 | 13F | Northwest & Ethical Investments L.P. | 75.262 | -28,82 | 738 | -22,09 | ||||
| 2026-02-17 | 13F | Schonfeld Strategic Advisors LLC | 17.860 | -78,29 | 175 | -76,22 | ||||
| 2026-02-12 | 13F | Scotia Capital Inc. | 0 | -100,00 | 0 | |||||
| 2026-02-10 | 13F | Godfrey Financial Associates, Inc. | 55 | 1 | ||||||
| 2026-01-14 | 13F | Cypress Wealth Services, LLC | 21.030 | -26,97 | 206 | -20,16 | ||||
| 2026-02-17 | 13F | CastleKnight Management LP | 157.700 | 1.547 | ||||||
| 2026-02-17 | 13F | Jones Financial Companies Lllp | 4.653 | 365,30 | 46 | 462,50 | ||||
| 2025-09-29 | NP | GOEX - Global X Gold Explorers ETF This fund is a listed as child fund of Mirae Asset Global Investments Co., Ltd. and if that institution has disclosed ownership in this security, then these positions will not be double counted when calculating total shares and total value | 202.181 | -5,03 | 1.307 | -1,36 | ||||
| 2026-02-17 | 13F | CastleKnight Management LP | Call | 100.000 | 981 | |||||
| 2026-02-13 | 13F | Causeway Capital Management Llc | 863.628 | 645,36 | 8.474 | 717,16 | ||||
| 2026-02-13 | 13F | Wells Fargo & Company/mn | 5.190 | -47,73 | 51 | -43,18 | ||||
| 2026-02-17 | 13F | Millennium Management Llc | 1.523.049 | -63,14 | 14.941 | -59,64 | ||||
| 2026-02-17 | 13F | Two Sigma Investments, Lp | 3.341.086 | -12,11 | 32.776 | -3,77 | ||||
| 2026-01-30 | 13F | R Squared Ltd | 0 | -100,00 | 0 | |||||
| 2025-09-29 | NP | CRNSX - CATHOLIC RESPONSIBLE INVESTMENTS INTERNATIONAL SMALL-CAP FUND Institutional Shares | 18.606 | -4,93 | 120 | -0,83 | ||||
| 2025-10-08 | 13F | Sheets Smith Investment Management | 166.059 | 1.488 | ||||||
| 2026-02-09 | 13F | Harbour Investments, Inc. | 1.775 | -31,07 | 17 | -26,09 | ||||
| 2026-01-21 | 13F | Stone House Investment Management, LLC | 36 | 157,14 | 0 | |||||
| 2026-02-13 | 13F | SRS Capital Advisors, Inc. | 441 | 47,00 | 4 | 100,00 | ||||
| 2026-02-13 | 13F | Alberta Investment Management Corp | 313.600 | 3.073 | ||||||
| 2026-02-18 | 13F | State of Tennessee, Treasury Department | 34.925 | -65,15 | 342 | -61,98 | ||||
| 2026-01-15 | 13F | SILVER OAK SECURITIES, Inc | 24.915 | 0,00 | 248 | 10,76 | ||||
| 2026-02-17 | 13F | DZ BANK AG Deutsche Zentral Genossenschafts Bank, Frankfurt am Main | 1.789.733 | -2,29 | 17.557 | 7,08 | ||||
| 2026-01-21 | 13F | Rathbone Brothers plc | 0 | -100,00 | 0 | |||||
| 2026-02-10 | 13F/A | Northwestern Mutual Wealth Management Co | 683 | 7 | ||||||
| 2026-01-26 | 13F | Merit Financial Group, LLC | 11.248 | 5,45 | 110 | 15,79 | ||||
| 2026-03-13 | 13F/A | Pensionmark Financial Group, Llc | 144.276 | 1.415 | ||||||
| 2026-02-10 | 13F | Quantbot Technologies LP | 62.176 | -86,64 | 610 | -85,39 | ||||
| 2026-02-17 | 13F | Amundi | 3.754.336 | 1,38 | 36.830 | 10,87 | ||||
| 2026-02-12 | 13F | Swiss National Bank | 607.930 | 1,28 | 5.969 | 11,03 | ||||
| 2026-02-17 | 13F | PDT Partners, LLC | 102.831 | 0,00 | 1.009 | 9,45 | ||||
| 2026-02-13 | 13F | Prudential Financial Inc | 37.200 | -19,48 | 365 | -11,62 | ||||
| 2026-02-17 | 13F | Pinnacle Financial Partners, Inc. | 28.500 | 280 | ||||||
| 2026-02-17 | 13F | Numerai GP LLC | 51.191 | -33,77 | 502 | -27,46 | ||||
| 2026-02-12 | 13F | Principal Securities, Inc. | 0 | -100,00 | 0 | -100,00 | ||||
| 2026-02-13 | 13F | Pine Valley Investments Ltd Liability Co | 383.771 | 0,89 | 3.765 | 10,45 | ||||
| 2026-02-17 | 13F | Capital Fund Management S.a. | Put | 56.200 | -44,08 | 551 | -38,78 | |||
| 2026-02-12 | 13F | Hollencrest Capital Management | 116.100 | 0,00 | 1.139 | 9,42 | ||||
| 2025-11-14 | 13F | SummitTX Capital, L.P. | 0 | -100,00 | 0 | |||||
| 2025-11-07 | 13F | Shell Asset Management Co | 4.682 | -73,38 | 0 | |||||
| 2026-02-17 | 13F | SIG North Trading, ULC | Put | 91.000 | -30,21 | 893 | -23,63 | |||
| 2026-02-17 | 13F | SIG North Trading, ULC | Call | 38.600 | -53,94 | 379 | -49,60 | |||
| 2026-02-06 | 13F | IFP Advisors, Inc | 3.000 | 29 | ||||||
| 2026-02-11 | 13F | Winton Capital Group Ltd | 29.400 | 288 | ||||||
| 2026-02-17 | 13F | Capital Fund Management S.a. | Call | 168.600 | -14,24 | 1.654 | -6,13 | |||
| 2026-02-17 | 13F | SIG North Trading, ULC | 192.842 | 111,27 | 1.892 | 131,46 | ||||
| 2026-02-13 | 13F | Peak6 Llc | Call | 191.600 | -87,83 | 1.880 | -86,68 | |||
| 2026-02-13 | 13F | Dynamic Technology Lab Private Ltd | 56.972 | -34,42 | 559 | -28,15 | ||||
| 2025-11-14 | 13F | Cubist Systematic Strategies, LLC | 1.401.371 | 45,44 | 12.555 | 99,24 | ||||
| 2026-02-09 | 13F | Legal & General Group Plc | 1.458.914 | 13,13 | 14.311 | 23,89 | ||||
| 2026-01-22 | 13F | Greenberg Financial Group | 10.000 | 98 | ||||||
| 2026-02-12 | 13F | Sprott Inc. | 276.085 | -9,46 | 2.708 | -0,88 | ||||
| 2026-02-13 | 13F | Y-Intercept (Hong Kong) Ltd | 206.504 | -32,19 | 2.026 | -25,77 | ||||
| 2026-02-05 | 13F | Navalign, LLC | 197 | 2 | ||||||
| 2026-02-12 | 13F | Groupe la Francaise | 695.000 | 0,00 | 6.809 | 9,31 | ||||
| 2026-02-13 | 13F | Citigroup Inc | 30.756 | 33,74 | 302 | 46,83 | ||||
| 2026-02-12 | 13F | BlackRock, Inc. | 63.079 | 3.153.850,00 | 619 | |||||
| 2026-02-02 | 13F | Wolverine Asset Management Llc | Put | 551.500 | 4,75 | 5.410 | 14,69 | |||
| 2026-02-17 | 13F | D. E. Shaw & Co., Inc. | Call | 271.800 | 165,69 | 2.666 | 191,05 | |||
| 2026-02-17 | 13F | D. E. Shaw & Co., Inc. | 7.527.066 | 19,97 | 73.832 | 31,35 | ||||
| 2026-02-04 | 13F | Plato Investment Management Ltd | 7.537 | 74 | ||||||
| 2026-02-17 | 13F | Canada Pension Plan Investment Board | 1.081.000 | -32,87 | 10.593 | -26,50 | ||||
| 2026-02-18 | 13F | Mackenzie Financial Corp | 1.761.664 | 330,04 | 17.509 | 377,58 | ||||
| 2026-02-10 | 13F | CIBC World Markets Inc. | 225.968 | 12,59 | 2.214 | 23,27 | ||||
| 2025-11-13 | 13F | Farringdon Capital, Ltd. | 0 | -100,00 | 0 | |||||
| 2026-02-10 | 13F | Close Asset Management Ltd | 10.000 | 0,00 | 0 | |||||
| 2026-02-17 | 13F | Prelude Capital Management, Llc | 23.534 | -48,56 | 231 | -43,77 | ||||
| 2025-10-23 | 13F | Kingswood Wealth Advisors, Llc | 0 | -100,00 | 0 | |||||
| 2026-02-10 | 13F | CIBC Asset Management Inc | 288.377 | -2,91 | 2.828 | 6,44 | ||||
| 2026-02-17 | 13F | Toronto Dominion Bank | 2.680.091 | -1,18 | 26.263 | 8,19 | ||||
| 2026-02-17 | 13F | Toronto Dominion Bank | Put | 3.200 | -31,91 | 31 | -26,19 | |||
| 2026-02-17 | 13F | Toronto Dominion Bank | Call | 4.300 | -35,82 | 42 | -28,81 | |||
| 2025-11-13 | 13F | Blueshift Asset Management, LLC | 0 | -100,00 | 0 | -100,00 | ||||
| 2025-11-14 | 13F | Marex Group plc | 0 | -100,00 | 0 | -100,00 | ||||
| 2026-01-14 | 13F | Klein Pavlis & Peasley Financial, Inc. | 119.262 | -6,78 | 1.170 | 2,01 | ||||
| 2026-01-15 | 13F | Hara Capital LLC | 2.700 | 0,00 | 26 | 8,33 | ||||
| 2026-02-13 | 13F | De Lisle Partners LLP | 228.775 | -23,43 | 2.245 | -16,17 | ||||
| 2026-02-17 | 13F | Jain Global LLC | 61.164 | 5,34 | 599 | 15,41 | ||||
| 2026-01-26 | 13F | Abbington Investment Group | 120.870 | 21,07 | 1.186 | 32,55 | ||||
| 2026-01-09 | 13F | SG Americas Securities, LLC | 59.736 | 1 | ||||||
| 2026-02-13 | 13F | BRITISH COLUMBIA INVESTMENT MANAGEMENT Corp | 163.075 | -8,84 | 1.598 | -0,19 | ||||
| 2026-02-13 | 13F | Integrated Wealth Concepts LLC | 0 | -100,00 | 0 | |||||
| 2026-02-12 | 13F | Jane Street Group, Llc | Call | 93.700 | 337,85 | 919 | 381,15 | |||
| 2026-02-13 | 13F | Kilter Group LLC | 43 | 0,00 | 0 | |||||
| 2026-02-12 | 13F | Jane Street Group, Llc | 2.420.469 | 382,63 | 23.745 | 428,47 | ||||
| 2026-02-06 | 13F | Profund Advisors Llc | 31.532 | -16,73 | 309 | -8,85 | ||||
| 2026-02-12 | 13F | Jane Street Group, Llc | Put | 68.300 | 64,18 | 670 | 80,11 | |||
| 2026-02-13 | 13F | Barclays Plc | 282.605 | 2,82 | 2.772 | 12,59 | ||||
| 2026-02-17 | 13F | Keebeck Alpha, LP | 23.534 | -48,56 | 231 | -43,77 | ||||
| 2026-02-14 | 13F | Rockefeller Capital Management L.P. | 1.000 | 0,00 | 10 | 12,50 | ||||
| 2026-02-17 | 13F | Cape Investment Advisory, Inc. | 100 | 1 | ||||||
| 2026-02-17 | 13F | Lazard Asset Management Llc | 61.523 | -61,79 | 603 | -58,22 | ||||
| 2026-02-19 | 13F | Invesco Ltd. | 3.004.000 | -3,68 | 29.469 | 5,46 | ||||
| 2026-02-10 | 13F | Hillsdale Investment Management Inc. | 1.361.635 | -50,78 | 13.367 | -46,02 | ||||
| 2026-02-13 | 13F | Quarry LP | 1.344 | -97,09 | 13 | -96,85 | ||||
| 2026-02-12 | 13F | Bank Of Montreal /can/ | Call | 511.500 | 5.012 | |||||
| 2026-02-11 | 13F | Tiaa Trust, National Association | 436.540 | 0,00 | 4.282 | 9,49 | ||||
| 2026-02-12 | 13F | Bank Of Montreal /can/ | Put | 20.800 | 204 | |||||
| 2026-02-12 | 13F | Bank Of Montreal /can/ | 3.496.112 | -15,22 | 34.260 | -7,18 | ||||
| 2026-01-21 | 13F | Sound Income Strategies, LLC | 1.000 | 0,00 | 10 | 25,00 | ||||
| 2026-01-30 | 13F | Oakworth Capital, Inc. | 200 | 0,00 | 2 | 0,00 | ||||
| 2026-02-13 | 13F | JustInvest LLC | 15.179 | 3,56 | 149 | 12,98 | ||||
| 2026-02-03 | 13F | SBI Securities Co., Ltd. | 3.127 | -5,81 | 31 | 3,45 | ||||
| 2026-02-10 | 13F | Acadian Asset Management Llc | 11.382.736 | -2,48 | 112 | 6,73 | ||||
| 2026-01-27 | 13F | Zurcher Kantonalbank (Zurich Cantonalbank) | 93.280 | 12,67 | 915 | 23,48 | ||||
| 2026-02-17 | 13F | Engineers Gate Manager LP | 85.180 | -66,92 | 836 | -63,81 | ||||
| 2026-02-04 | 13F | Swiss Life Asset Management Ltd | 33.947 | 141,89 | 333 | 165,60 | ||||
| 2026-02-11 | 13F | Allianz Asset Management GmbH | 188.495 | 2,45 | 1.850 | 12,26 | ||||
| 2026-02-17 | 13F | Captrust Financial Advisors | 12.485 | 0,00 | 122 | 9,91 | ||||
| 2025-11-14 | 13F | Point72 Asia (Singapore) Pte. Ltd. | 0 | -100,00 | 0 | |||||
| 2026-02-02 | 13F | Wolverine Asset Management Llc | Call | 128.100 | 128.000,00 | 1.257 | ||||
| 2026-02-04 | 13F | Versor Investments LP | 0 | -100,00 | 0 | |||||
| 2026-02-17 | 13F | Brevan Howard Capital Management LP | 111.207 | 456,01 | 1.091 | 508,94 | ||||
| 2026-02-13 | 13F | Colony Group, LLC | 12.471 | 122 | ||||||
| 2026-02-04 | 13F | Centric Wealth Management | 11.000 | 10,00 | 108 | 30,49 | ||||
| 2025-09-26 | NP | OWSMX - Old Westbury Small & Mid Cap Strategies Fund | 74.000 | -81,25 | 477 | -76,13 | ||||
| 2025-11-14 | 13F | Axa S.a. | 0 | -100,00 | 0 | |||||
| 2026-01-20 | 13F | Coastal Investment Advisors, Inc. | 55.650 | -38,46 | 546 | -32,72 | ||||
| 2026-02-06 | 13F | Leonteq Securities AG | 2.000 | 0,00 | 27 | 8,33 | ||||
| 2026-01-27 | 13F | Proffitt & Goodson Inc | 2.500 | 0,00 | 25 | 9,09 | ||||
| 2026-02-10 | 13F | State of Wyoming | 22.190 | 218 | ||||||
| 2026-02-11 | 13F | Vise Technologies, Inc. | 0 | -100,00 | 0 | |||||
| 2026-02-12 | 13F | CoreCommodity Management, LLC | 76.897 | -18,09 | 754 | -10,34 | ||||
| 2025-11-14 | 13F | Capstone Investment Advisors, Llc | 30.057 | 269 | ||||||
| 2026-02-02 | 13F | PKO Investment Management Joint-Stock Co | 104.377 | 0,00 | 1.025 | 9,64 | ||||
| 2025-10-27 | 13F | Kiker Wealth Management, LLC | 0 | -100,00 | 0 | |||||
| 2026-03-04 | 13F | SHP Wealth Management | 100 | 1 | ||||||
| 2026-02-17 | 13F | Russell Investments Group, Ltd. | 990.008 | -4,69 | 9.718 | 4,56 | ||||
| 2026-02-17 | 13F | Massar Capital Management, LP | 43.914 | 431 | ||||||
| 2026-02-11 | 13F | Franklin Resources Inc | 183.514 | 7,56 | 1.798 | 17,75 | ||||
| 2026-02-06 | 13F | Larson Financial Group LLC | 442 | 281,03 | 4 | 300,00 | ||||
| 2026-02-17 | 13F | Parallax Volatility Advisers, L.P. | Call | 400.000 | 0,00 | 3.924 | 9,49 | |||
| 2026-02-09 | 13F | Geode Capital Management, Llc | 1.464.898 | 17,84 | 19.002 | 27,95 | ||||
| 2025-11-14 | 13F | Beacon Pointe Advisors, LLC | 0 | -100,00 | 0 | |||||
| 2026-02-17 | 13F | Citadel Advisors Llc | Call | 453.400 | 4,21 | 4.448 | 14,08 | |||
| 2026-02-17 | 13F | Citadel Advisors Llc | 207.063 | -88,93 | 2.031 | -87,88 | ||||
| 2026-02-17 | 13F | Advisor Group Holdings, Inc. | 10.774 | 63,19 | 106 | 94,44 | ||||
| 2026-02-17 | 13F | Citadel Advisors Llc | Put | 174.300 | -34,08 | 1.710 | -27,86 | |||
| 2026-02-13 | 13F | American Century Companies Inc | 8.269.909 | 2,96 | 81.053 | 12,69 | ||||
| 2026-02-13 | 13F | Aire Advisors, Llc | 0 | -100,00 | 0 | |||||
| 2026-02-05 | 13F | Cardinal Point Capital Management, ULC | 28.750 | -21,12 | 282 | -13,50 | ||||
| 2026-02-17 | 13F | Susquehanna International Group, Llp | 416.874 | 422,37 | 4.090 | 471,89 | ||||
| 2026-02-03 | 13F | McIlrath & Eck, LLC | 300 | 0,00 | 3 | 0,00 | ||||
| 2026-02-04 | 13F | Tsfg, Llc | 1.000 | 0,00 | 0 | |||||
| 2026-02-17 | 13F | Susquehanna International Group, Llp | Put | 351.000 | 47,54 | 3.443 | 61,57 | |||
| 2026-02-12 | 13F | Skopos Labs, Inc. | 17.577 | 175 | ||||||
| 2026-01-28 | 13F | CAPROCK Group, Inc. | 36.868 | 104,94 | 362 | 161,59 | ||||
| 2026-02-17 | 13F | Fmr Llc | 0 | -100,00 | 0 | |||||
| 2026-02-17 | 13F | Susquehanna International Group, Llp | Call | 1.144.700 | -6,40 | 11.230 | 2,47 | |||
| 2026-02-06 | 13F | Global Retirement Partners, LLC | 233 | 0,00 | 2 | 0,00 | ||||
| 2026-02-13 | 13F | BNP Paribas Asset Management Holding S.A. | 252.533 | 3 | ||||||
| 2026-02-17 | 13F | PharVision Advisers, LLC | 19.895 | -21,39 | 195 | -13,72 | ||||
| 2026-02-05 | 13F | Chase Investment Counsel Corp | 371.199 | 4 | ||||||
| 2026-01-14 | 13F | Generali Investments CEE, investicni spolecnost, a.s. | 8.000 | 0,00 | 78 | 9,86 | ||||
| 2025-09-26 | NP | TAISX - TIAA-CREF Quant International Small-Cap Equity Fund Advisor Class | 957.806 | -6,21 | 6.180 | -3,00 | ||||
| 2026-02-12 | 13F | Steward Partners Investment Advisory, Llc | 5.000 | 0,00 | 49 | 11,36 | ||||
| 2026-02-13 | 13F | Public Sector Pension Investment Board | 0 | -100,00 | 0 | |||||
| 2025-11-14 | 13F | Evelyn Partners Investment Management (Europe) Ltd | 0 | -100,00 | 0 | -100,00 | ||||
| 2025-12-09 | 13F/A | Tudor Investment Corp Et Al | 25.378 | -74,41 | 227 | -64,97 | ||||
| 2026-02-11 | 13F | Simplex Trading, Llc | 10.934 | 107 | ||||||
| 2026-02-12 | 13F | Commonwealth Equity Services, Llc | 19.072 | -2,69 | 187 | |||||
| 2026-02-17 | 13F | Raymond James Financial Inc | 57.955 | 91,40 | 569 | 109,59 | ||||
| 2026-02-17 | 13F | Two Sigma Securities, Llc | 13.299 | 130 | ||||||
| 2026-01-23 | 13F | Assetmark, Inc | 65 | 0,00 | 1 | |||||
| 2026-02-13 | 13F | Morgan Stanley | 8.472.690 | -7,38 | 83.117 | 1,41 | ||||
| 2026-01-20 | 13F | Sheets Smith Wealth Management | 68.973 | -0,06 | 677 | 9,39 | ||||
| 2026-02-13 | 13F | Mariner, LLC | 96.874 | 134,42 | 950 | 156,76 | ||||
| 2026-02-05 | 13F | Baader Bank INC | 0 | -100,00 | 0 | |||||
| 2025-11-14 | 13F | Capula Management Ltd | 0 | -100,00 | 0 | -100,00 | ||||
| 2026-02-17 | 13F | Capital Fund Management S.a. | 555.821 | 49,22 | 5.453 | 63,38 | ||||
| 2026-02-18 | 13F | Vident Advisory, LLC | 40.323 | -86,98 | 396 | -85,76 | ||||
| 2025-11-14 | 13F | Walleye Capital LLC | 0 | -100,00 | 0 | -100,00 | ||||
| 2026-02-17 | 13F | Susquehanna Advisors Group, Inc. | 33.700 | 331 | ||||||
| 2026-02-17 | 13F | SPWM Advisors LLC | 10.010 | 98 | ||||||
| 2026-02-13 | 13F | Virtus ETF Advisers LLC | 37.681 | 0,00 | 370 | 9,50 | ||||
| 2025-11-13 | 13F | FORA Capital, LLC | 0 | -100,00 | 0 | -100,00 | ||||
| 2026-01-08 | 13F | Dagco, Inc. | 800 | 0,00 | 8 | 0,00 | ||||
| 2025-11-07 | 13F | Synovus Financial Corp | 28.500 | 0,00 | 255 | 37,10 | ||||
| 2026-01-21 | 13F | Towarzystwo Funduszy Inwestycyjnych Allianz Polska S.A. | 145.600 | 14,11 | 1.449 | 26,68 | ||||
| 2026-01-23 | 13F | Ritholtz Wealth Management | 175.396 | 104,18 | 1.721 | 123,67 | ||||
| 2026-02-17 | 13F | Jump Financial, LLC | 475.726 | 4.667 | ||||||
| 2026-02-06 | 13F | EverSource Wealth Advisors, LLC | 5.363 | -0,72 | 53 | 8,33 | ||||
| 2026-02-13 | 13F | Manufacturers Life Insurance Company, The | 0 | -100,00 | 0 | |||||
| 2026-02-17 | 13F/A | Sentinus, LLC | 10.500 | 103 | ||||||
| 2025-09-26 | NP | HAOSX - Harbor Overseas Fund Institutional Class | 129.279 | 834 | ||||||
| 2025-11-14 | 13F | Virtu Financial LLC | 0 | -100,00 | 0 | |||||
| 2026-01-30 | 13F | Pvg Asset Management Corp | 25.960 | 255 | ||||||
| 2026-02-13 | 13F | Walleye Trading LLC | Put | 23.300 | 1.692,31 | 229 | 1.972,73 | |||
| 2026-02-13 | 13F | Walleye Trading LLC | Call | 78.900 | 155,34 | 774 | 180,43 | |||
| 2026-02-24 | 13F | Chelsea Counsel Co | 8.680 | 0,00 | 85 | 10,39 | ||||
| 2026-01-27 | 13F | WealthCollab, LLC | 1.762 | 0,00 | 17 | 13,33 | ||||
| 2026-02-17 | 13F | Ancora Advisors, LLC | 1.332 | 0,00 | 13 | 18,18 | ||||
| 2026-02-17 | 13F | Scientech Research LLC | 29.297 | 287 | ||||||
| 2026-02-12 | 13F | Hohimer Wealth Management, Llc | 0 | -100,00 | 0 | |||||
| 2026-02-17 | 13F | Qube Research & Technologies Ltd | 2.547.053 | 1.614,33 | 24.987 | 1.777,24 | ||||
| 2026-02-11 | 13F | Prudential Plc | 43.120 | -7,35 | 423 | 1,44 | ||||
| 2026-02-10 | 13F | Connor, Clark & Lunn Investment Management Ltd. | 573.130 | -78,37 | 5.616 | -76,33 | ||||
| 2026-02-17 | 13F | Gotham Asset Management, LLC | 363.376 | 41,85 | 3.565 | 55,29 | ||||
| 2026-02-02 | 13F | Miracle Mile Advisors, LLC | 15.000 | 0,00 | 147 | 9,70 | ||||
| 2026-02-09 | 13F | IPG Investment Advisors LLC | 30.500 | 0,00 | 299 | 9,52 | ||||
| 2026-02-17 | 13F | Royal Bank Of Canada | 1.047.884 | 80,78 | 10.279 | 97,94 | ||||
| 2026-02-12 | 13F | Renaissance Technologies Llc | 1.517.600 | -31,83 | 14.888 | -25,36 | ||||
| 2026-02-13 | 13F | Squarepoint Ops LLC | Put | 11.300 | 0,00 | 111 | 8,91 | |||
| 2026-02-18 | 13F | GWM Advisors LLC | 211.355 | 6,31 | 2.073 | 16,40 | ||||
| 2025-11-14 | 13F | Point72 (DIFC) Ltd | 0 | -100,00 | 0 | |||||
| 2026-02-17 | 13F | Quantitative Investment Management, LLC | 0 | -100,00 | 0 | |||||
| 2026-02-17 | 13F | Tower Research Capital LLC (TRC) | 100 | -91,43 | 1 | -100,00 | ||||
| 2026-02-24 | 13F | DGS Capital Management, LLC | 10.454 | -3,22 | 103 | 6,25 | ||||
| 2025-09-29 | NP | SIL - Global X Silver Miners ETF This fund is a listed as child fund of Mirae Asset Global Investments Co., Ltd. and if that institution has disclosed ownership in this security, then these positions will not be double counted when calculating total shares and total value | 9.043.819 | 18,06 | 58.480 | 22,62 | ||||
| 2026-01-12 | 13F | DAVENPORT & Co LLC | 50.700 | 0,00 | 497 | 9,47 | ||||
| 2026-02-13 | 13F | Arrowstreet Capital, Limited Partnership | 20.216.810 | 3,52 | 198.176 | 13,33 | ||||
| 2026-02-10 | 13F | Goldman Sachs Group Inc | 3.977.108 | -45,66 | 39.015 | -40,51 | ||||
| 2026-02-10 | 13F | Savant Capital, LLC | 45.798 | 4,80 | 449 | 14,83 | ||||
| 2026-02-17 | 13F | Optiver Holding B.V. | 0 | -100,00 | 0 | |||||
| 2026-02-17 | 13F | Alliancebernstein L.p. | 138.939 | 217,50 | 1.363 | 247,45 | ||||
| 2026-02-10 | 13F | PCJ Investment Counsel Ltd. | 486.520 | 24,20 | 4.768 | 35,97 | ||||
| 2026-02-17 | 13F | Graham Capital Management, L.P. | 27.338 | 31,97 | 268 | 44,86 | ||||
| 2026-02-17 | 13F | New Vernon Capital Holdings II LLC | 7.475 | 0,00 | 101 | 51,52 | ||||
| 2026-02-13 | 13F | Verition Fund Management LLC | 22.000 | -56,42 | 216 | -52,43 | ||||
| 2025-11-14 | 13F | Squarepoint Ops LLC | 0 | -100,00 | 0 | -100,00 | ||||
| 2026-02-17 | 13F | Cetera Investment Advisers | 14.343 | 22,19 | 141 | 33,33 | ||||
| 2026-01-27 | 13F | TD Waterhouse Canada Inc. | 49.252 | 146,70 | 483 | 172,32 | ||||
| 2026-02-11 | 13F | Erste Asset Management GmbH | 65.600 | 651 | ||||||
| 2026-01-28 | 13F | U S Global Investors Inc | 560.601 | 5.499 | ||||||
| 2026-01-28 | 13F | Geneos Wealth Management Inc. | 4.100 | 2,50 | 40 | 14,29 | ||||
| 2026-02-17 | 13F | Perritt Capital Management Inc | 0 | -100,00 | 0 | |||||
| 2026-02-13 | 13F | Caitong International Asset Management Co., Ltd | 883 | -47,57 | 9 | -46,67 | ||||
| 2026-01-29 | 13F | Pictet Asset Management Holding SA | 55.920 | 12,29 | 549 | 23,15 | ||||
| 2026-02-06 | 13F | Banque Cantonale Vaudoise | 595 | 6 | ||||||
| 2026-01-23 | 13F | Rsm Us Wealth Management Llc | 11.688 | 1,82 | 116 | 13,73 | ||||
| 2026-02-13 | 13F | Centiva Capital, LP | 12.884 | 126 | ||||||
| 2026-01-29 | 13F | Vanguard Group Inc | 8.255.178 | 80,95 | 80.892 | 98,06 | ||||
| 2026-02-10 | 13F | Td Asset Management Inc | 1.629.640 | -7,69 | 15.990 | 1,14 | ||||
| 2026-02-17 | 13F | Advisory Services Network, LLC | 0 | -100,00 | 0 | |||||
| 2026-02-12 | 13F | Dimensional Fund Advisors Lp | 10.066.599 | 8,15 | 98.758 | 18,43 | ||||
| 2025-11-12 | 13F | Catalyst Funds Management Pty Ltd | 0 | -100,00 | 0 | |||||
| 2026-02-11 | 13F | LPL Financial LLC | 120.628 | -24,98 | 1.183 | -17,85 | ||||
| 2025-11-14 | 13F | ExodusPoint Capital Management, LP | 160.085 | -44,61 | 1.434 | 143.300,00 | ||||
| 2026-02-13 | 13F | Aigen Investment Management, Lp | 0 | -100,00 | 0 | |||||
| 2026-02-17 | 13F | Two Sigma Advisers, Lp | 1.207.100 | -1,83 | 11.842 | 7,48 | ||||
| 2026-02-17 | 13F | Trexquant Investment LP | 971.709 | -40,74 | 9.532 | -35,12 | ||||
| 2026-02-12 | 13F | Hrt Financial Lp | 246.537 | 2 | ||||||
| 2026-02-17 | 13F | Crabel Capital Management, LLC | 0 | -100,00 | 0 | |||||
| 2025-09-26 | NP | FTIHX - Fidelity Total International Index Fund This fund is a listed as child fund of Fmr Llc and if that institution has disclosed ownership in this security, then these positions will not be double counted when calculating total shares and total value | 141.508 | -0,59 | 913 | 2,59 | ||||
| 2025-09-26 | NP | MSTVX - Morningstar Alternatives Fund | Short | -48.511 | -0,31 | -313 | 2,63 | |||
| 2026-02-06 | 13F | Auxano Advisors, LLC | 200.000 | 1.962 | ||||||
| 2026-02-12 | 13F | Federation des caisses Desjardins du Quebec | 158.579 | 0,95 | 1.554 | 12,12 | ||||
| 2025-11-12 | 13F | Headlands Technologies LLC | 0 | -100,00 | 0 | |||||
| 2026-01-26 | 13F | PFG Investments, LLC | 13.579 | 0,00 | 133 | 9,92 | ||||
| 2026-02-03 | 13F | Farmers & Merchants Investments Inc | 150 | 0,00 | 1 | 0,00 | ||||
| 2025-11-14 | 13F | Algert Global Llc | 0 | -100,00 | 0 | |||||
| 2026-01-21 | 13F | Carolina Wealth Advisors, LLC | 245 | 0,00 | 2 | 0,00 | ||||
| 2026-01-21 | 13F/A | Euro Pacific Asset Management, LLC | 4.464.769 | 0,88 | 43 | 10,26 | ||||
| 2026-02-04 | 13F | Drive Wealth Management, Llc | 13.973 | 2,66 | 137 | 13,22 | ||||
| 2026-01-14 | 13F | ORG Partners LLC | 600 | 5.900,00 | 6 | |||||
| 2026-02-12 | 13F | Nuveen, LLC | 2.584.403 | -13,51 | 25.359 | -5,23 | ||||
| 2026-02-13 | 13F | Smartleaf Asset Management LLC | 2.374 | 24 | ||||||
| 2026-01-14 | 13F | Sicart Associates LLC | 648.736 | 1,96 | 6.364 | 11,65 | ||||
| 2026-02-17 | 13F | Voloridge Investment Management, Llc | 2.221.012 | 6,67 | 21.788 | 16,79 | ||||
| 2026-01-21 | 13F | Flagship Harbor Advisors, Llc | 394 | 4 | ||||||
| 2026-02-13 | 13F | Toroso Investments, LLC | 9.666.827 | 8,04 | 94.832 | 18,29 | ||||
| 2026-01-07 | 13F | Aventura Private Wealth, LLC | 1.500 | 0,00 | 15 | 7,69 | ||||
| 2026-01-29 | 13F | UBS Group AG | Put | 300.000 | 0,00 | 2.943 | 9,49 | |||
| 2026-01-29 | 13F | UBS Group AG | 2.695.663 | 34,80 | 26.444 | 47,58 | ||||
| 2026-02-10 | 13F | Bnp Paribas Arbitrage, Sa | 37.112 | -21,16 | 364 | -13,54 | ||||
| 2025-09-26 | NP | PMPIX - Precious Metals Ultrasector Profund Investor Class | 23.267 | -6,51 | 150 | -3,23 | ||||
| 2026-02-04 | 13F | Independent Advisor Alliance | 14.930 | -2,07 | 146 | 7,35 | ||||
| 2026-02-13 | 13F | Bridgefront Capital, LLC | 19.804 | 194 | ||||||
| 2026-02-13 | 13F | Neuberger Berman Group LLC | 142.084 | 76,44 | 1.394 | 93,34 | ||||
| 2026-02-10 | 13F | Root Financial Partners, LLC | 93 | 0,00 | 1 | |||||
| 2025-11-24 | 13F | Penn Capital Management Co Inc | 0 | -100,00 | 0 | -100,00 | ||||
| 2026-02-17 | 13F | XTX Topco Ltd | 61.686 | -57,66 | 605 | -53,64 | ||||
| 2026-02-17 | 13F | Public Employees Retirement System Of Ohio | 812.040 | -2,17 | 7.968 | 7,18 | ||||
| 2026-02-13 | 13F | Kestra Advisory Services, LLC | 7.920 | 78 | ||||||
| 2026-01-13 | 13F | West Financial Advisors, LLC | 150 | 0,00 | 1 | 0,00 | ||||
| 2026-01-20 | 13F | AdvisorNet Financial, Inc | 3.135 | -18,25 | 31 | -11,76 | ||||
| 2026-02-17 | 13F | Bank Of America Corp /de/ | 1.600.972 | 181,32 | 15.706 | 208,00 | ||||
| 2026-02-17 | 13F | MIRAE ASSET GLOBAL ETFS HOLDINGS Ltd. | 18.013.453 | 31,42 | 176.751 | 44,00 | ||||
| 2026-02-17 | 13F | Investment Management Corp of Ontario | 37.673 | 230,90 | 370 | 261,76 | ||||
| 2026-02-10 | 13F | Envestnet Asset Management Inc | 25.254 | 56,50 | 248 | 71,53 | ||||
| 2025-09-26 | NP | PASIX - PACE Alternative Strategies Investments Class A | Short | -18.245 | -0,69 | -118 | 2,63 | |||
| 2025-11-14 | 13F | Ubs Asset Management Americas Inc | 0 | -100,00 | 0 | |||||
| 2026-02-17 | 13F | Point72 Asset Management, L.P. | 700.334 | 546,89 | 6.869 | 608,88 | ||||
| 2025-09-29 | NP | PDN - Invesco FTSE RAFI Developed Markets ex-U.S. Small-Mid ETF This fund is a listed as child fund of Invesco Ltd. and if that institution has disclosed ownership in this security, then these positions will not be double counted when calculating total shares and total value | 53.198 | -16,39 | 344 | -13,38 | ||||
| 2026-01-29 | 13F | UMA Financial Services, Inc. | 60 | 1 | ||||||
| 2026-02-11 | 13F | O'shaughnessy Asset Management, Llc | 897.363 | -3,33 | 8.798 | 5,86 | ||||
| 2026-01-23 | 13F | Farther Finance Advisors, LLC | 8.629 | 0,47 | 85 | 10,53 | ||||
| 2026-02-17 | 13F | Aqr Capital Management Llc | 138.788 | 1.360 | ||||||
| 2026-02-05 | 13F | Cambridge Investment Research Advisors, Inc. | 48.590 | -17,92 | 0 | |||||
| 2025-09-29 | NP | AIM SECTOR FUNDS (INVESCO SECTOR FUNDS) - Invesco Oppenheimer Gold & Special Minerals Fund Class C | 292.539 | -89,12 | 1.887 | -88,78 | ||||
| 2026-02-09 | 13F | Employees Retirement System of Texas | 7.263 | 0,00 | 0 | |||||
| 2026-01-13 | 13F | Kathmere Capital Management, LLC | 14.115 | 138 | ||||||
| 2026-02-13 | 13F | Entropy Technologies, LP | 77.192 | 757 |