| Acțiuni restante | 172,842,665 shares |
| Acțiuni Insider | 46.231.864 shares |
| Proprietatea din interior | 26,75 % |
| Total Insiders | 5 |
Scorul de sentimente din interior
Insider Sentiment Score găsește companiile cumpărate de persoane din interior.
Este rezultatul unui model cantitativ sofisticat, multifactorial, care identifică companiile cu cele mai înalte niveluri de acumulare de persoane interne. Modelul de scoring folosește o combinație a numărului net de persoane din interior care cumpără în ultimele 90 de zile, totalul acțiunilor cumpărate ca procent din flota și totalul acțiunilor deținute de insider. Numărul variază de la 0 la 100, numerele mai mari indicând un nivel mai ridicat de acumulare pentru semenii săi, iar 50 fiind media.
Frecvența actualizării: zilnic
Scorul de sentiment al ofițerului
Scorul de sentiment al ofițerilor găsește companii cumpărate de ofițerii corporativi.
Prin definiție, Ofițerii Corporativi sunt Corporate Insiders, dar spre deosebire de unii dintre ceilalți Insiders (10% Acționari și Membri ai Consiliului de Administrație), Ofițerii lucrează zilnic pentru companie și își folosesc banii atunci când tranzacționează . (10% acționari și membri ai consiliului de administrație sunt adesea administratori de fonduri care gestionează banii altor persoane.) Ca atare, tranzacțiile privilegiate efectuate de către ofițeri sunt mult mai semnificative și ar trebui tratate în mod corespunzător.
La fel ca Scorul Sentimentului Insider, Scorul Sentimentului Ofițerului este rezultatul unui model cantitativ sofisticat, multifactorial, care identifică companiile cu cele mai înalte niveluri de acumulare de ofițeri.
Frecvența actualizării: zilnic
Vedeți Top Picks Insiders, care oferă o listă a companiilor cu cel mai mare sentiment din interior.
Valori cheie ale insiderului
Acest card arată modul în care compania se clasifică de-a lungul diferitelor valori interne. Clasamentul percentilei arată cum se compară această companie cu alte companii de pe piețele din SUA. Clasamentele mai înalte indică situații mai bune.
De exemplu, este în general acceptat că cumpărarea din interior este un indicator pozitiv, astfel încât companiile cu mai multe achiziții din interior s-ar clasa mai sus decât companiile cu mai puține achiziții din interior (sau chiar vânzări din interior).
Numărul net de persoane din interior care cumpără (clasament)
2376 out of 10931
Numărul net de persoane din interior care cumpără este numărul total de persoane din interior care cumpără minus numărul total de persoane din interior care au vândut în ultimele 90 de zile. Rangul percentilei este afișat aici (interval de la 0 la 100%).
Procent din flota cumpărată de persoane din interior (clasament)
2415 out of 10788
Procent of Float Bought by Insiders este numărul total de acțiuni cumpărate de insiders minus numărul total de acțiuni vândute de insiders în ultimele 90 de zile, împărțit la flota totală și înmulțit cu 100.
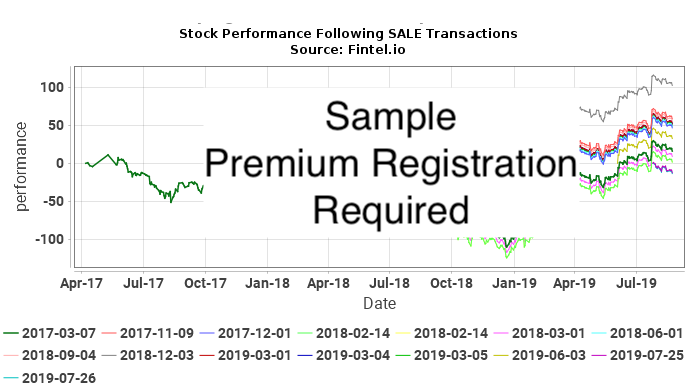
Graficul privind tranzacțiile privilegiate
Nascent Biotech, Inc. tranzacții privilegiate sunt prezentate în graficul următor. Insiders sunt ofițeri, directori sau investitori importanți într-o companie. În general, este în general ilegal ca persoanele din interior să facă tranzacții în companiile lor pe baza unor informații materiale, nepublice. Acest lucru nu înseamnă că este ilegal pentru ei să facă tranzacții în propriile companii. Cu toate acestea, ei trebuie să raporteze toate tranzacțiile către SEC printr-un Formular 4.
Lista de persoane din interior și valori de profitabilitate
Acest tabel prezintă lista persoanelor din interior cunoscute și este generată automat din dosarele dezvăluite SEC. Pe lângă nume, cel mai recent titlu și desemnarea directorului, a ofițerului sau a proprietarului în proporție de 10%, oferim cele mai recente dețineri divulgate. În plus, atunci când este posibil, oferim performanța comercială istorică pentru persoane din interior. Performanța comercială istorică este o medie ponderată a performanței tranzacțiilor reale de cumpărare pe piață deschisă efectuate de către insider. Pentru mai multe informații despre cum se calculează, urmăriți acest webinar YouTube.
See our leaderboard of most profitable insider traders.
| Insider | Profit mediu (%) | Acțiuni Deținut |
Despică Ajustat |
|---|---|---|---|
|
Sean Carrick
President & CEO, Director, 10% Owner -
[D]
[O]
|
23.126.007 | 23.126.007 |
| Insider | Profit mediu (%) | Acțiuni Deținut |
Despică Ajustat |
|---|---|---|---|
|
Mark Glassy
10% Owner -
|
4.276.500 | 4.276.500 | |
| Lowell Thomas Holden CFO, Director - [D] [O] | 10.005.477 | 10.005.477 |
| Insider | Profit mediu (%) | Acțiuni Deținut |
Despică Ajustat |
|---|---|---|---|
| Douglas John Karas Director - [D] | 1.821.552 | 1.821.552 | |
|
Brandon Price
Senior VP Business Development, Director, 10% Owner -
[D]
[O]
|
7.002.328 | 7.002.328 |
Report errors via our new Insider Auditing Tool
Înregistrări ale achizițiilor interne - Analiza profitului pe termen scurt
În această secțiune, analizăm profitabilitatea fiecărei achiziții neplanificate, pe piață deschisă, efectuată în NBIO / Nascent Biotech, Inc.. Această analiză ajută la înțelegerea dacă persoana din interior generează în mod constant profituri anormale și merită urmărită. Această analiză este pentru un an după fiecare tranzacție și rezultatele sunt teoretice .
Următorul tabel prezintă cele mai recente achiziții pe piața deschisă care nu făceau parte dintr-un plan de tranzacționare automată.
Prețul ajustat este prețul ajustat în divizarea. Acțiunile ajustate reprezintă acțiunile ajustate în funcție de divizarea.
Înregistrări ale vânzărilor din interior - Analiza pierderilor pe termen scurt
În această secțiune, analizăm evitarea pierderilor pe termen scurt a fiecărei vânzări neplanificate, pe piață deschisă, efectuată în NBIO / Nascent Biotech, Inc.. Un model consistent de evitare a pierderilor poate sugera că viitoarele tranzacții de vânzare pot prezice scăderi ale prețului. Această analiză este pentru un an după fiecare tranzacție și rezultatele sunt teoretice .
Următorul tabel arată cele mai recente vânzări pe piața deschisă care nu făceau parte dintr-un plan de tranzacționare automată.
| Data tranzacției | Insider | Raportat Acțiuni |
Raportat Preț |
Ajustat Acțiuni |
Ajustat Preț |
Baza costurilor | Zile pentru Min |
Pret la Min |
Pierdere maximă Evitat ($) |
Pierdere maximă Evitat (%) |
|---|---|---|---|---|---|---|---|---|---|---|
| 2022-07-21 | HOLDEN LOWELL THOMAS | 5.000 | 0,2600 | 5.000 | 0,2600 | 1.300 | 323 | 0.0395 | -1.102 | -84,81 |
Prețul ajustat este prețul ajustat în divizarea. Acțiunile ajustate reprezintă acțiunile ajustate în funcție de divizarea.
Istoricul tranzactiilor
Faceți clic pe pictograma link pentru a vedea istoricul complet al tranzacțiilor. Tranzacțiile raportate ca parte a unui plan de tranzacționare automată 10b5-1 vor avea un X în coloana marcată 10b-5.
| Fişier Data |
Comerț Data |
Formă | Insider | Ticker | Titlul de securitate | Cod | Direct | Exercițiu Preț |
Unitate Preț |
Unități Schimbat |
Valoare Schimbat (1K) |
Rămas Opțiuni |
Rămas Acțiuni |
|
|---|---|---|---|---|---|---|---|---|---|---|---|---|---|---|
| 2024-07-02 | 2024-06-30 | 4 | Carrick Sean | NBIO | Common stock | D | 0,0900 | 192.000 | 17 | 23.126.007 | ||||
| 2024-07-02 | 2024-06-30 | 4 | HOLDEN LOWELL THOMAS | NBIO | Common stock | D | 0,0900 | 96.000 | 9 | 10.005.477 | ||||
| 2024-07-02 | 2024-06-30 | 4 | Karas Douglas John | NBIO | Common stock | D | 0,1000 | 50.000 | 5 | 1.821.552 | ||||
| 2024-04-10 | 2024-03-31 | 4 | HOLDEN LOWELL THOMAS | NBIO | Common Stock | D | 0,1845 | 112.500 | 21 | 9.909.477 | ||||
| 2024-04-10 | 2024-03-31 | 4 | Karas Douglas John | NBIO | Common Stock | D | 0,1845 | 27.100 | 5 | 1.771.552 | ||||
| 2024-04-10 | 2024-03-31 | 4 | Carrick Sean | NBIO | Common Stock | D | 0,1845 | 225.000 | 42 | 22.934.007 | ||||
| 2024-02-27 | 2023-12-29 | 4 | Carrick Sean | NBIO | Common Stock | D | 0,1700 | 239.300 | 41 | 22.709.007 | ||||
| 2024-02-27 | 2023-12-29 | 4 | Karas Douglas John | NBIO | Common Stock | D | 0,1800 | 28.935 | 5 | 1.744.452 | ||||
| 2024-02-27 | 2023-12-29 | 4 | HOLDEN LOWELL THOMAS | NBIO | Common Stock | D | 0,1700 | 119.650 | 20 | 9.796.977 | ||||
| 2023-11-09 | 2023-09-29 | 4 | HOLDEN LOWELL THOMAS | NBIO | Common Stock | D | 0,1250 | 1.386.300 | 173 | 9.677.327 | ||||
| 2023-11-09 | 2023-09-29 | 4 | Carrick Sean | NBIO | Common Stock | D | 0,1250 | 2.772.600 | 347 | 22.469.707 | ||||
| 2023-11-09 | 2023-09-29 | 4 | Karas Douglas John | NBIO | Common Stock | D | 0,1250 | 39.750 | 5 | 1.715.517 | ||||
| 2023-07-14 | 2023-06-29 | 4 | Carrick Sean | NBIO | Common Stock | D | 0,0500 | -960.000 | -48 | 19.697.107 | ||||
| 2023-07-13 | 2023-06-29 | 4 | HOLDEN LOWELL THOMAS | NBIO | Common Stock | D | 0,0490 | -700.000 | -34 | 8.291.027 | ||||
| 2023-06-09 | 2023-03-31 | 4 | Karas Douglas John | NBIO | Common Stock | D | 0,0600 | 89.285 | 5 | 1.575.767 | ||||
| 2023-06-09 | 2023-06-07 | 4 | HOLDEN LOWELL THOMAS | NBIO | Common stock | D | 0,0400 | 130.000 | 5 | 8.409.277 | ||||
| 2023-06-09 | 2023-03-31 | 4 | HOLDEN LOWELL THOMAS | NBIO | Common stock | D | 0,0600 | 581.000 | 35 | 8.279.277 | ||||
| 2023-06-09 | 2023-03-31 | 4 | Carrick Sean | NBIO | Common Stock | D | 0,0600 | 1.167.000 | 70 | 19.233.607 | ||||
| 2023-02-14 | 2023-02-09 | 4 | HOLDEN LOWELL THOMAS | NBIO | Common stock | D | 0,1200 | -700.000 | -84 | 7.798.277 | ||||
| 2023-02-02 | 2023-01-27 | 4 | HOLDEN LOWELL THOMAS | NBIO | Common Stock | D | 0,1400 | 20.000 | 3 | 8.418.277 | ||||
| 2023-02-02 | 2023-01-27 | 4 | HOLDEN LOWELL THOMAS | NBIO | Common Stock | D | 0,1400 | 20.000 | 3 | 8.418.277 | ||||
| 2023-01-03 | 2022-12-30 | 4 | HOLDEN LOWELL THOMAS | NBIO | Common Stock | D | 0,2000 | 231.000 | 46 | 8.398.277 | ||||
| 2023-01-03 | 2022-12-30 | 4 | Carrick Sean | NBIO | Common Stock | D | 0,2000 | 462.000 | 92 | 18.071.607 | ||||
| 2023-01-03 | 2022-12-30 | 4 | Karas Douglas John | NBIO | Common Stock | D | 0,2000 | 25.000 | 5 | 1.486.482 | ||||
| 2022-07-25 | 2022-07-21 | 4 | HOLDEN LOWELL THOMAS | NBIO | Common Stock | D | 0,2600 | -5.000 | -1 | 8.112.277 | ||||
| 2022-04-19 | 2022-04-14 | 4 | HOLDEN LOWELL THOMAS | NBIO | Common stock | D | 0,0800 | -700.000 | -56 | 8.283.077 | ||||
| 2022-04-04 | 2022-03-31 | 4 | Carrick Sean | NBIO | Common Stock | D | 0,0560 | 430.000 | 24 | 17.451.131 | ||||
| 2022-04-04 | 2022-03-09 | 4 | Carrick Sean | NBIO | Common Stock | D | 0,0500 | 1.000.000 | 50 | 17.021.131 | ||||
| 2022-04-04 | 2022-03-31 | 4 | HOLDEN LOWELL THOMAS | NBIO | Common Stock | D | 0,0560 | 215.000 | 12 | 8.983.077 | ||||
| 2022-04-04 | 2022-03-09 | 4 | HOLDEN LOWELL THOMAS | NBIO | Common Stock | D | 0,0500 | 1.100.000 | 55 | 8.768.077 | ||||
| 2022-04-04 | 2022-03-09 | 4 | Karas Douglas John | NBIO | Common Stock | D | 0,0500 | 300.000 | 15 | 1.427.853 | ||||
| 2022-02-08 | 2021-06-30 | 4 | Carrick Sean | NBIO | Common Stock | D | 0,1050 | 347.400 | 36 | 16.021.131 | ||||
| 2022-02-08 | 2022-01-07 | 4 | HOLDEN LOWELL THOMAS | NBIO | Common Stock | D | 0,0500 | -1.700.000 | -85 | 7.141.777 | ||||
| 2022-02-08 | 2021-06-30 | 4 | HOLDEN LOWELL THOMAS | NBIO | Common Stock | D | 0,1050 | 173.700 | 18 | 8.841.777 | ||||
| 2022-02-08 | 2021-04-15 | 4 | HOLDEN LOWELL THOMAS | NBIO | Common Stock | D | 0,0500 | -1.700.000 | -85 | 8.668.077 | ||||
| 2021-08-20 | 2021-06-30 | 4 | HOLDEN LOWELL THOMAS | NBIO | Common Stock | D | 0,0610 | 173.700 | 11 | 8.841.777 | ||||
| 2021-08-20 | 2021-06-30 | 4 | HOLDEN LOWELL THOMAS Gift | NBIO | Common Stock | I | 0,1050 | -700.000 | -74 | 8.668.077 | ||||
| 2021-08-20 | 2021-06-30 | 4 | Carrick Sean | NBIO | Common Stock | D | 0,1050 | 347.400 | 36 | 16.021.131 | ||||
| 2021-08-20 | 2021-06-30 | 4 | Karas Douglas John | NBIO | Common Stock | D | 0,1050 | 83.334 | 9 | 1.127.854 | ||||
| 2021-08-20 | 2021-04-09 | 4 | Karas Douglas John | NBIO | Common Stock | D | 0,0760 | 307.010 | 23 | 1.044.520 | ||||
| 2021-04-06 | 2021-03-31 | 4 | Karas Douglas John | NBIO | Common Stock | D | 0,0700 | 83.334 | 6 | 773.224 | ||||
| 2021-04-06 | 2021-03-31 | 4 | Carrick Sean | NBIO | Common Stock | D | 0,0610 | 1.620.000 | 99 | 15.673.731 | ||||
| 2021-04-06 | 2021-03-26 | 4 | Carrick Sean | NBIO | Common Stock | D | 0,0600 | 1.250.000 | 75 | 14.048.731 | ||||
| 2021-04-06 | 2021-03-31 | 4 | HOLDEN LOWELL THOMAS | NBIO | Common Stock | D | 0,0610 | 810.000 | 49 | 10.368.077 | ||||
| 2021-04-06 | 2021-03-26 | 4 | HOLDEN LOWELL THOMAS | NBIO | Common Stock | D | 0,0600 | 1.000.000 | 60 | 9.558.077 | ||||
| 2021-01-11 | 2020-12-31 | 4 | Carrick Sean | NBIO | Common Stock | D | 0,0461 | 2.884.000 | 133 | 12.803.731 | ||||
| 2021-01-11 | 2020-09-30 | 4 | Carrick Sean | NBIO | Common Stock | D | 0,1000 | 218.715 | 22 | 9.919.731 | ||||
| 2021-01-11 | 2020-12-31 | 4 | Karas Douglas John | NBIO | Common Stock | D | 0,0460 | 108.460 | 5 | 689.890 | ||||
| 2021-01-11 | 2020-11-20 | 4 | Karas Douglas John | NBIO | Common Stock | D | 0,0500 | 350.000 | 18 | 581.490 | ||||
| 2021-01-11 | 2020-09-30 | 4 | Karas Douglas John | NBIO | Common Stock | D | 0,0700 | 71.430 | 5 | 231.490 | ||||
| 2021-01-11 | 2020-12-31 | 4 | HOLDEN LOWELL THOMAS | NBIO | Common Stock | D | 0,0461 | 1.442.000 | 66 | 8.558.077 | ||||
| 2021-01-11 | 2020-09-30 | 4 | HOLDEN LOWELL THOMAS | NBIO | Common Stock | D | 0,0700 | 127.970 | 9 | 7.116.077 | ||||
| 2020-07-02 | 2020-06-29 | 4 | HOLDEN LOWELL THOMAS | NBIO | Common Stock | D | 0,1000 | 534.000 | 53 | 6.988.107 | ||||
| 2020-07-02 | 2020-06-24 | 4 | HOLDEN LOWELL THOMAS | NBIO | Common Stock (conversion of debt to equity) | D | 0,1000 | 2.901.890 | 290 | 6.454.107 | ||||
| 2020-07-02 | 2020-06-29 | 4 | Price Brandon | NBIO | Common Stock | D | 0,1000 | 534.000 | 53 | 7.002.328 | ||||
| 2020-07-02 | 2020-06-24 | 4 | Price Brandon | NBIO | Common Stock (conversion of debt to equity) | D | 0,1000 | 2.821.830 | 282 | 6.468.328 | ||||
| 2020-07-02 | 2020-06-29 | 4 | Carrick Sean | NBIO | Common Stock | D | 0,1000 | 889.000 | 89 | 9.701.016 | ||||
| 2020-07-02 | 2020-06-24 | 4 | Carrick Sean | NBIO | Common Stock (Conversion of debt to equity) | D | 0,1000 | 6.155.000 | 616 | 8.812.016 | ||||
| 2020-05-13 | 2020-05-11 | 4 | HOLDEN LOWELL THOMAS | NBIO | Common Stock | D | 0,1000 | 1.000.000 | 100 | 3.562.217 | ||||
| 2020-04-03 | 2020-03-27 | 4 | Price Brandon | NBIO | Common stock | D | 0,1300 | 265.160 | 34 | 2.694.117 | ||||
| 2020-04-03 | 2020-03-27 | 4 | HOLDEN LOWELL THOMAS | NBIO | Common stock | D | 0,1300 | 265.160 | 34 | 20.000 | ||||
| 2020-04-03 | 2020-03-27 | 4 | HOLDEN LOWELL THOMAS Spouse | NBIO | Common stock | I | 0,1300 | 265.160 | 34 | 20.000 | ||||
| 2020-04-03 | 2020-03-27 | 4 | Carrick Sean | NBIO | Common stock | D | 0,1300 | 441.930 | 57 | 2.657.016 | ||||
| 2020-01-06 | 2019-12-30 | 4 | Price Brandon | NBIO | Common Stock | D | 0,1000 | 56.700 | 6 | 2.428.957 | ||||
| 2020-01-06 | 2019-12-30 | 4 | Price Brandon | NBIO | Common Stock (conversion of debt to equity) | D | 0,1000 | 700.000 | 70 | 2.372.257 | ||||
| 2020-01-06 | 2019-12-30 | 4 | HOLDEN LOWELL THOMAS | NBIO | Common Stock | D | 0,1000 | 56.700 | 6 | 2.287.057 | ||||
| 2020-01-06 | 2019-12-30 | 4 | HOLDEN LOWELL THOMAS | NBIO | Common Stock (conversion of debt to equity) | D | 0,1000 | 830.000 | 83 | 2.230.357 | ||||
| 2020-01-06 | 2019-12-26 | 4 | HOLDEN LOWELL THOMAS | NBIO | Common Stock | D | 0,1650 | 5.000 | 1 | 2.292.057 | ||||
| 2020-01-06 | 2019-12-30 | 4 | Carrick Sean | NBIO | Common Stock | D | 0,1000 | 94.500 | 9 | 2.215.086 | ||||
| 2020-01-06 | 2019-12-30 | 4 | Carrick Sean | NBIO | Common Stock (conversion of debt to equity) | D | 0,1000 | 210.000 | 21 | 2.120.586 | ||||
| 2020-01-06 | 2019-12-30 | 4 | Glassy Mark | NBIO | Common Stock (conversion of debt to equity) | D | 0,1000 | 90.000 | 9 | 4.276.500 | ||||
| 2019-10-07 | 2019-09-30 | 4 | Carrick Sean | NBIO | Common Stock | D | 0,1260 | 12.500 | 2 | 1.910.586 | ||||
| 2019-10-07 | 2019-10-03 | 4 | HOLDEN LOWELL THOMAS Relative | NBIO | Common Stock | I | 0,1400 | 10.000 | 1 | 1.410.357 | ||||
| 2019-10-07 | 2019-09-30 | 4 | HOLDEN LOWELL THOMAS | NBIO | Common Stock | D | 0,1280 | 7.500 | 1 | 1.400.357 | ||||
| 2019-10-07 | 2019-09-30 | 4 | Price Brandon | NBIO | Common Stock | D | 0,1260 | 7.500 | 1 | 1.672.257 | ||||
| 2019-07-08 | 2019-06-25 | 4 | Price Brandon | NBIO | Common Stock | D | 0,1860 | 23.965 | 4 | 1.664.757 | ||||
| 2019-07-08 | 2019-06-25 | 4 | Karas Douglas John | NBIO | Common Stock | D | 0,1860 | 50.000 | 9 | 110.000 | ||||
| 2019-07-08 | 2019-06-25 | 4 | Carrick Sean | NBIO | Common Stock | D | 0,1860 | 39.942 | 7 | 1.898.086 | ||||
| 2019-07-08 | 2019-06-25 | 4 | HOLDEN LOWELL THOMAS | NBIO | Common Stock | D | 0,1860 | 23.965 | 4 | 1.392.857 | ||||
| 2019-06-06 | 2019-06-04 | 4 | HOLDEN LOWELL THOMAS | NBIO | Common Stock | D | 0,1540 | 271.318 | 42 | 1.368.892 | ||||
| 2019-06-06 | 2019-06-04 | 4 | Price Brandon | NBIO | Common Stock | D | 0,1540 | 368.218 | 57 | 1.640.792 | ||||
| 2019-04-17 | 2019-03-25 | 4 | Carrick Sean | NBIO | Common Stock | D | 0,1500 | 100.637 | 15 | 1.858.144 | ||||
| 2019-04-17 | 2018-12-31 | 4 | Carrick Sean | NBIO | Common Stock | D | 0,1700 | 30.337 | 5 | 1.757.507 | ||||
| 2019-04-17 | 2019-03-25 | 4 | HOLDEN LOWELL THOMAS | NBIO | Common Stock | D | 0,1500 | 63.200 | 9 | 1.097.574 | ||||
| 2019-04-17 | 2018-12-31 | 4 | HOLDEN LOWELL THOMAS | NBIO | Common Stock | D | 0,1700 | 18.202 | 3 | 1.034.374 | ||||
| 2019-04-17 | 2019-03-26 | 4 | Price Brandon | NBIO | Common Stock | D | 0,1500 | 63.200 | 9 | 1.272.574 | ||||
| 2019-04-17 | 2018-12-31 | 4 | Price Brandon | NBIO | Common Stock | D | 0,1700 | 18.202 | 3 | 1.209.374 | ||||
| 2018-10-02 | 2018-09-28 | 4 | HOLDEN LOWELL THOMAS | NBIO | Common Stock | D | 0,1900 | 59.683 | 11 | 1.016.172 | ||||
| 2018-10-02 | 2018-06-28 | 4 | HOLDEN LOWELL THOMAS | NBIO | Common Stock | D | 0,5000 | 23.942 | 12 | 956.485 | ||||
| 2018-10-02 | 2018-09-28 | 4 | Carrick Sean | NBIO | Common Stock | D | 0,1900 | 99.478 | 19 | 1.727.170 | ||||
| 2018-10-02 | 2018-06-28 | 4 | Carrick Sean | NBIO | Common Stock | D | 0,5000 | 39.904 | 20 | 1.627.692 | ||||
| 2018-10-02 | 2018-09-28 | 4 | Price Brandon | NBIO | Common Stock | D | 0,1900 | 59.687 | 11 | 1.191.172 | ||||
| 2018-10-02 | 2018-06-28 | 4 | Price Brandon | NBIO | Common Stock | D | 0,5000 | 23.942 | 12 | 1.131.485 | ||||
| 2018-06-11 | 2017-08-14 | 4 | Karas Douglas John | NBIO | Common Stock | D | 0,2200 | 50.000 | 11 | 60.000 | ||||
| 2018-06-11 | 2015-04-03 | 4 | Karas Douglas John | NBIO | Common Stock | D | 1,0000 | 10.000 | 10 | 10.000 | ||||
| 2018-06-05 | 2018-03-30 | 4 | Carrick Sean | NBIO | Common Stock | D | 0,2500 | 25.350 | 6 | 1.587.788 | ||||
| 2018-06-05 | 2017-12-29 | 4 | Carrick Sean | NBIO | Common Stock | D | 0,1800 | 12.685 | 2 | 1.562.438 | ||||
| 2018-06-05 | 2017-09-27 | 4 | Carrick Sean | NBIO | Common Stock | D | 0,2500 | 163.923 | 41 | 1.549.753 | ||||
| 2018-06-05 | 2017-06-26 | 4 | Carrick Sean | NBIO | Common Stock | D | 0,3000 | 34.464 | 10 | 1.385.830 | ||||
| 2018-06-05 | 2018-03-30 | 4 | HOLDEN LOWELL THOMAS | NBIO | Common Stock | D | 0,2500 | 15.210 | 4 | 932.547 | ||||
| 2018-06-05 | 2017-12-29 | 4 | HOLDEN LOWELL THOMAS | NBIO | Common Stock | D | 0,1800 | 7.601 | 1 | 917.337 | ||||
| 2018-06-05 | 2017-09-27 | 4 | HOLDEN LOWELL THOMAS | NBIO | Common Stock | D | 0,2500 | 98.354 | 25 | 909.736 | ||||
| 2018-06-05 | 2017-06-26 | 4 | HOLDEN LOWELL THOMAS | NBIO | Common Stock | D | 0,3000 | 20.678 | 6 | 811.382 | ||||
| 2018-06-05 | 2018-03-30 | 4 | Price Brandon | NBIO | Common Stock | D | 0,2500 | 15.210 | 4 | 1.107.543 | ||||
| 2018-06-05 | 2017-12-29 | 4 | Price Brandon | NBIO | Common Stock | D | 0,1800 | 7.601 | 1 | 1.092.333 | ||||
| 2018-06-05 | 2017-09-27 | 4 | Price Brandon | NBIO | Common Stock | D | 0,2500 | 98.354 | 25 | 1.084.732 | ||||
| 2018-06-05 | 2017-06-26 | 4 | Price Brandon | NBIO | Common Stock | D | 0,3000 | 20.678 | 6 | 986.378 | ||||
| 2017-10-10 | 2017-09-28 | 4 | Carrick Sean | NBIO | Common Stock | D | 0,2480 | 163.923 | 41 | 1.549.753 | ||||
| 2017-10-10 | 2017-06-29 | 4 | Carrick Sean | NBIO | Common Stock | D | 0,3000 | 34.464 | 10 | 1.385.830 | ||||
| 2017-10-10 | 2017-10-09 | 4 | HOLDEN LOWELL THOMAS By spouse | NBIO | Common Stock | I | 0,2500 | 10.000 | 2 | 919.732 | ||||
| 2017-10-10 | 2017-09-28 | 4 | HOLDEN LOWELL THOMAS | NBIO | Common Stock | D | 0,2480 | 98.354 | 24 | 909.732 | ||||
| 2017-10-10 | 2017-06-29 | 4 | HOLDEN LOWELL THOMAS | NBIO | Common Stock | D | 0,3000 | 20.678 | 6 | 811.378 | ||||
| 2017-10-10 | 2017-09-28 | 4 | Price Brandon | NBIO | Common Stock | D | 0,2480 | 98.354 | 24 | 1.084.732 | ||||
| 2017-10-10 | 2017-06-29 | 4 | Price Brandon | NBIO | Common Stock | D | 0,3000 | 20.678 | 6 | 986.378 | ||||
| 2017-04-04 | 2017-03-28 | 4 | Carrick Sean | NBIO | Common Stock | D | 0,3800 | 63.688 | 24 | 1.351.366 | ||||
| 2017-04-04 | 2017-03-28 | 4 | Price Brandon | NBIO | Common Stock | D | 0,3800 | 38.213 | 15 | 965.700 | ||||
| 2017-04-04 | 2017-03-28 | 4 | HOLDEN LOWELL THOMAS | NBIO | Common Stock | D | 0,3800 | 38.213 | 15 | 790.700 | ||||
| 2017-01-09 | 2016-12-30 | 4 | HOLDEN LOWELL THOMAS | NBIO | Common Stock | D | 0,3500 | 7.800 | 3 | 752.487 | ||||
| 2017-01-09 | 2016-12-30 | 4 | Price Brandon | NBIO | Common Stock | D | 0,3500 | 7.800 | 3 | 927.487 | ||||
| 2017-01-09 | 2016-12-30 | 4 | Carrick Sean | NBIO | Common Stock | D | 0,3500 | 13.000 | 5 | 1.287.678 | ||||
| 2016-01-05 | 2015-10-08 | 4/A | Carrick Sean Spouse | NBIO | Common Stock | I | 0,2000 | 1.500 | 0 | 1.227.601 | ||||
| 2016-01-05 | 2015-09-04 | 4/A | Carrick Sean | NBIO | Common Stock | D | 1,4500 | 1.028.901 | 1.492 | 1.226.101 | ||||
| 2016-01-05 | 2015-09-04 | 4/A | Price Brandon | NBIO | Common Stock | D | 1,4500 | 617.346 | 895 | 892.346 | ||||
| 2016-01-05 | 2015-09-04 | 4/A | HOLDEN LOWELL THOMAS | NBIO | Common Stock | D | 1,4500 | 617.346 | 895 | 717.346 | ||||
| 2015-10-13 | 2015-10-08 | 4 | Carrick Sean | NBIO | Common Stock | D | 0,2000 | 1.500 | 0 | 1.227.601 | ||||
| 2015-10-13 | 2015-09-04 | 4 | Carrick Sean | NBIO | Common Stock | D | 1,4500 | 1.028.901 | 1.492 | 1.226.101 | ||||
| 2015-10-13 | 2015-09-04 | 4 | HOLDEN LOWELL THOMAS | NBIO | Common Stock | D | 1,4500 | 617.346 | 895 | 717.346 | ||||
| 2015-10-13 | 2015-09-04 | 4 | Price Brandon | NBIO | Common Stock | D | 1,4500 | 617.346 | 895 | 892.346 | ||||
| 2015-07-02 | 3 | Price Brandon | NBIO | Common Stock | D | 550.000 | ||||||||
| 2015-07-02 | 3 | Price Brandon | NBIO | Common Stock | D | 550.000 | ||||||||
| 2015-01-05 | 3 | Carrick Sean | NBIO | Common Stock | D | 400.400 | ||||||||
| 2015-01-05 | 3 | Carrick Sean | NBIO | Common Stock | D | 400.400 | ||||||||
| 2014-12-31 | 3 | Glassy Mark | NBIO | Common Stock | D | 8.373.000 | ||||||||
| 2014-12-31 | 3 | Glassy Mark | NBIO | Common Stock | D | 8.373.000 | ||||||||
| 2014-12-31 | 3 | HOLDEN LOWELL THOMAS | NBIO | Common Stock | D | 200.000 | ||||||||
| 2014-12-31 | 3 | HOLDEN LOWELL THOMAS | NBIO | Common Stock | D | 200.000 |
P
Piața deschisă sau achiziția privată de titluri nederivate sau derivate
S
Piața deschisă sau vânzarea privată a titlurilor de valoare nederivate sau derivate
A
Acordarea, atribuirea sau alte achiziții de valori mobiliare de la companie (cum ar fi o opțiune)
C
Conversia derivatei
D
Vânzarea sau transferul de valori mobiliare înapoi către companie
F
Plata prețului de exercițiu sau a obligației fiscale folosind o parte din titlurile de valoare primite de la companie
G
Donarea de valori mobiliare de către sau către persoane din interior
K
Swap-uri de acțiuni și tranzacții similare de acoperire împotriva riscurilor
M
Exercitarea sau conversia titlurilor derivate primite de la companie (cum ar fi o opțiune)
V
O tranzacție raportată voluntar pe Formularul 4
J
Altele (însoțite de o notă de subsol care descrie tranzacția)