Janus International Group, Inc.
Introducere
Această pagină oferă o analiză cuprinzătoare a istoricului cunoscut al tranzacțiilor privilegiate a Roger Fradin. Insiders sunt ofițeri, directori sau investitori importanți într-o companie. Este ilegal ca persoanele din interior să facă tranzacții în companiile lor pe baza unor informații specifice, nepublice. Acest lucru nu înseamnă că este ilegal pentru ei să facă tranzacții în propriile companii. Cu toate acestea, ei trebuie să raporteze toate tranzacțiile către SEC printr-un Formular 4. În ciuda acestor restricții, cercetările academice sugerează că persoanele din interior - în general - tind să depășească piața în propriile companii.
Rentabilitatea medie comercială
Rentabilitatea medie a comerțului este randamentul mediu al tuturor achizițiilor de pe piața deschisă efectuate de persoane din interior în ultimii trei ani. Pentru a calcula acest lucru, examinăm fiecare achiziție neplanificată pe piață deschisă făcută de către insider, excluzând toate tranzacțiile care au fost marcate ca parte a unui plan de tranzacționare 10b5-1. Apoi calculăm performanța medie a acelor tranzacții pe 3, 6 și 12 luni, făcând o medie a fiecărei durate pentru a genera o valoare finală a performanței pentru fiecare tranzacție. În cele din urmă, facem o medie a tuturor valorilor de performanță pentru a calcula o valoare de performanță pentru persoana din interior. Această listă include doar persoane din interior care au efectuat cel puțin trei tranzacții în ultimii doi ani.
Dacă profitabilitatea acestei tranzacții este „N/A”, atunci acesta fie nu a făcut nicio achiziție pe piața deschisă în ultimii trei ani, fie tranzacțiile pe care le-au făcut sunt prea recente pentru a calcula o măsură de performanță fiabilă.
Frecvența actualizării: zilnic
Consultați lista celor mai profitabili comercianți din interior.
Companii cu poziții din interior raportate
Înregistrările SEC indică faptul că Roger Fradin a raportat participații sau tranzacții în următoarele companii:
| Securitate | Titlu | Ultimele participații raportate |
|---|---|---|
| US:LHX / L3Harris Technologies, Inc. | Director | 6.890 |
| US:VRT / Vertiv Holdings Co | Director | 30.000 |
| US:JBI / Janus International Group, Inc. | Director | 752.460 |
| US:REZI / Resideo Technologies, Inc. | Director | 231.002 |
| Director, 10% Owner | 0 | |
| US:MSM / MSC Industrial Direct Co., Inc. | Director | 21 |
| US:PBI / Pitney Bowes Inc. | Director | 17.301 |
| US:HON / Honeywell International Inc. | Vice Chairman | 0 |
Cum se interpretează diagramele
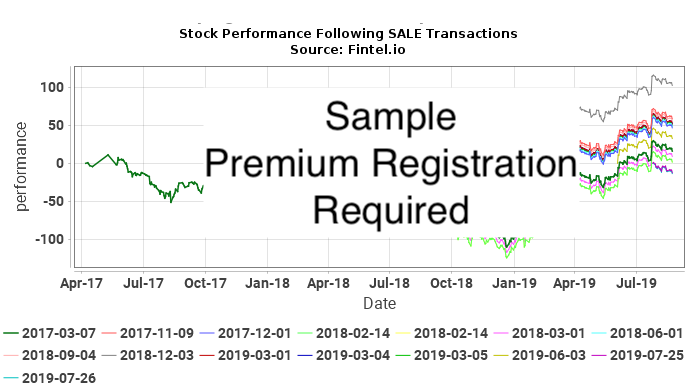
Următoarele diagrame arată performanța acțiunilor de valori mobiliare ulterioare fiecărei tranzacții neplanificate pe piață deschisă efectuată de Roger Fradin. Comerțurile neplanificate sunt tranzacții care nu au fost efectuate ca parte a unui plan de tranzacționare 10b5-1. Performanța acțiunilor este reprezentată ca variație procentuală cumulată a prețului acțiunilor. De exemplu, dacă o tranzacție privilegiată a fost efectuată la 1 ianuarie 2019, graficul va afișa modificarea procentuală zilnică a titlului până în prezent. Dacă prețul acțiunilor ar merge de la 10 USD la 15 USD în acest timp, modificarea procentuală cumulativă a prețului acțiunilor ar fi de 50%. O modificare a prețului de la 10 USD la 20 USD ar fi 100%, iar o modificare a prețului de la 10 USD la 5 USD ar fi -50%.
În cele din urmă, încercăm să determinăm cât de strâns se corelează tranzacțiile insider-ului cu randamentele în exces (pozitive sau negative) ale prețului acțiunilor, pentru a vedea dacă insider-ul își programează tranzacțiile pentru a profita de informațiile privilegiate. Luați în considerare situația în care un insider făcea asta. În această situație, ne-am aștepta fie la (a) randamente pozitive după achiziții, fie (b) la profituri negative după vânzare. În cazul punctului (a), graficul CUMPĂRĂRI ar arăta o serie de curbe în pantă ascendentă, indicând randamente pozitive după fiecare tranzacție de cumpărare. În cazul (b), graficul VÂNZARE ar arăta o serie de curbe înclinate în jos, indicând randamente negative după fiecare tranzacție de vânzare.
Cu toate acestea, acest lucru în sine nu este suficient pentru a trage concluzii. Dacă, de exemplu, prețul acțiunilor companiei a fost într-o creștere neciclică de-a lungul multor ani, atunci ne-am aștepta ca toate parcelele post-cumpărare să fie în pantă ascendentă. De asemenea, scăderile non-ciclice de-a lungul multor ani ar avea ca rezultat o pantă descendentă post-tranzacționare. Niciunul dintre aceste grafice nu ar sugera activitate de tranzacționare a informațiilor privilegiate.
Cel mai puternic indicator ar fi o situație în care prețul acțiunilor a fost extrem de ciclic, și au existat atât semnale pozitive în graficul CUMPĂRARE, cât și grafice negative pe graficul VÂNZARE. Această situație ar sugera foarte mult un insider care a programat tranzacțiile în avantajul lor financiar.
Achiziții din interior JBI / Janus International Group, Inc. - Analiza profitului pe termen scurt
În această secțiune, analizăm profitabilitatea fiecărei achiziții neplanificate, pe piață deschisă, efectuată în JBI / Janus International Group, Inc.. Această analiză ajută la înțelegerea dacă persoana din interior generează în mod constant profituri anormale și merită urmărită. Această analiză este pentru un an după fiecare tranzacție, iar rezultatele sunt teoretice .
Următorul tabel prezintă cele mai recente achiziții pe piața deschisă care nu făceau parte dintr-un plan de tranzacționare automată.
| Data tranzacției | Ticker | Insider | Raportat Acțiuni |
Raportat Preț |
Ajustat Acțiuni |
Ajustat Preț |
Baza costurilor | Zile pentru Max |
Pret la Max |
Max Profit ($) |
Randament maxim (%) |
|---|---|---|---|---|---|---|---|
| Nu se cunosc tranzacții neplanificate pe piața deschisă pentru această combinație de informații privilegiate și de securitate |
Prețul ajustat este prețul ajustat în divizarea. Acțiunile ajustate sunt acțiunile ajustate în funcție de divizarea.
Vânzări din interior JBI / Janus International Group, Inc. - Analiza pierderilor pe termen scurt
În această secțiune, analizăm evitarea pierderilor pe termen scurt a fiecărei vânzări neplanificate, pe piață deschisă, efectuată în JBI / Janus International Group, Inc.. Un model consistent de evitare a pierderilor poate sugera că viitoarele tranzacții de vânzare pot prezice scăderi ale prețului. Această analiză este pentru un an după fiecare tranzacție, iar rezultatele sunt teoretice .
Următorul tabel arată cele mai recente vânzări pe piața deschisă care nu făceau parte dintr-un plan de tranzacționare automată.
Prețul ajustat este prețul ajustat în divizarea. Acțiunile ajustate sunt acțiunile ajustate în funcție de divizarea.
Achiziții din interior MSM / MSC Industrial Direct Co., Inc. - Analiza profitului pe termen scurt
În această secțiune, analizăm profitabilitatea fiecărei achiziții neplanificate, pe piață deschisă, efectuată în JBI / Janus International Group, Inc.. Această analiză ajută la înțelegerea dacă persoana din interior generează în mod constant profituri anormale și merită urmărită. Această analiză este pentru un an după fiecare tranzacție, iar rezultatele sunt teoretice .
Următorul tabel prezintă cele mai recente achiziții pe piața deschisă care nu făceau parte dintr-un plan de tranzacționare automată.
| Data tranzacției | Ticker | Insider | Raportat Acțiuni |
Raportat Preț |
Ajustat Acțiuni |
Ajustat Preț |
Baza costurilor | Zile pentru Max |
Pret la Max |
Max Profit ($) |
Randament maxim (%) |
|---|---|---|---|---|---|---|---|
| Nu se cunosc tranzacții neplanificate pe piața deschisă pentru această combinație de informații privilegiate și de securitate |
Prețul ajustat este prețul ajustat în divizarea. Acțiunile ajustate sunt acțiunile ajustate în funcție de divizarea.
Vânzări din interior MSM / MSC Industrial Direct Co., Inc. - Analiza pierderilor pe termen scurt
În această secțiune, analizăm evitarea pierderilor pe termen scurt a fiecărei vânzări neplanificate, pe piață deschisă, efectuată în JBI / Janus International Group, Inc.. Un model consistent de evitare a pierderilor poate sugera că viitoarele tranzacții de vânzare pot prezice scăderi ale prețului. Această analiză este pentru un an după fiecare tranzacție, iar rezultatele sunt teoretice .
Următorul tabel arată cele mai recente vânzări pe piața deschisă care nu făceau parte dintr-un plan de tranzacționare automată.
| Data tranzacției | Ticker | Insider | Raportat Acțiuni |
Raportat Preț |
Ajustat Acțiuni |
Ajustat Preț |
Baza costurilor | Zile pentru Min |
Pret la Min |
Pierdere maximă Evitat ($) |
Pierdere maximă Evitat (%) |
|---|---|---|---|---|---|---|---|
| Nu se cunosc tranzacții neplanificate pe piața deschisă pentru această combinație de informații privilegiate și de securitate |
Prețul ajustat este prețul ajustat în divizarea. Acțiunile ajustate sunt acțiunile ajustate în funcție de divizarea.
Achiziții din interior REZI / Resideo Technologies, Inc. - Analiza profitului pe termen scurt
În această secțiune, analizăm profitabilitatea fiecărei achiziții neplanificate, pe piață deschisă, efectuată în JBI / Janus International Group, Inc.. Această analiză ajută la înțelegerea dacă persoana din interior generează în mod constant profituri anormale și merită urmărită. Această analiză este pentru un an după fiecare tranzacție, iar rezultatele sunt teoretice .
Următorul tabel prezintă cele mai recente achiziții pe piața deschisă care nu făceau parte dintr-un plan de tranzacționare automată.
Prețul ajustat este prețul ajustat în divizarea. Acțiunile ajustate sunt acțiunile ajustate în funcție de divizarea.
Vânzări din interior REZI / Resideo Technologies, Inc. - Analiza pierderilor pe termen scurt
În această secțiune, analizăm evitarea pierderilor pe termen scurt a fiecărei vânzări neplanificate, pe piață deschisă, efectuată în JBI / Janus International Group, Inc.. Un model consistent de evitare a pierderilor poate sugera că viitoarele tranzacții de vânzare pot prezice scăderi ale prețului. Această analiză este pentru un an după fiecare tranzacție, iar rezultatele sunt teoretice .
Următorul tabel arată cele mai recente vânzări pe piața deschisă care nu făceau parte dintr-un plan de tranzacționare automată.
| Data tranzacției | Ticker | Insider | Raportat Acțiuni |
Raportat Preț |
Ajustat Acțiuni |
Ajustat Preț |
Baza costurilor | Zile pentru Min |
Pret la Min |
Pierdere maximă Evitat ($) |
Pierdere maximă Evitat (%) |
|---|---|---|---|---|---|---|---|
| Nu se cunosc tranzacții neplanificate pe piața deschisă pentru această combinație de informații privilegiate și de securitate |
Prețul ajustat este prețul ajustat în divizarea. Acțiunile ajustate sunt acțiunile ajustate în funcție de divizarea.
Istoricul tranzacțiilor privilegiate
Acest tabel arată lista completă a tranzacțiilor privilegiate efectuate de Roger Fradin, astfel cum a fost dezvăluită Comisiei pentru Bursa de Valori Valori (SEC).
| Data fișierului | Tran Data | Formă | Ticker | Securitate | Cod | Acțiuni | Acțiuni rămase | La sută Schimbare |
Acțiune Preț |
Tran Valoare |
Rămas Valoare |
|
|---|---|---|---|---|---|---|---|---|---|---|---|---|
| 2026-05-12 |
|
4 | LHX |
L3HARRIS TECHNOLOGIES, INC. /DE/
Common Stock, Par Value $1.00 |
A - Award | 661 | 6.890 | 10,61 | ||||
| 2026-03-02 |
|
4 | VRT |
Vertiv Holdings Co
Class A Common Stock |
S - Sale | -530 | 30.000 | -1,74 | 252,02 | -133.571 | 7.560.600 | |
| 2026-03-02 |
|
4 | VRT |
Vertiv Holdings Co
Class A Common Stock |
S - Sale | -9.470 | 30.530 | -23,68 | 251,53 | -2.381.989 | 7.679.211 | |
| 2026-03-02 |
|
4 | VRT |
Vertiv Holdings Co
Class A Common Stock |
S - Sale | -200 | 0 | -100,00 | 254,09 | -50.818 | ||
| 2026-03-02 |
|
4 | VRT |
Vertiv Holdings Co
Class A Common Stock |
S - Sale | -16.181 | 200 | -98,78 | 253,49 | -4.101.722 | 50.698 | |
| 2026-03-02 |
|
4 | VRT |
Vertiv Holdings Co
Class A Common Stock |
S - Sale | -17.293 | 16.381 | -51,35 | 252,29 | -4.362.851 | 4.132.762 | |
| 2026-03-02 |
|
4 | VRT |
Vertiv Holdings Co
Class A Common Stock |
S - Sale | -20.909 | 33.674 | -38,31 | 251,62 | -5.261.123 | 8.473.052 | |
| 2026-03-02 |
|
4 | VRT |
Vertiv Holdings Co
Class A Common Stock |
S - Sale | -16.275 | 35.000 | -31,74 | 252,26 | -4.105.532 | 8.829.100 | |
| 2026-03-02 |
|
4 | VRT |
Vertiv Holdings Co
Class A Common Stock |
S - Sale | -20.808 | 51.275 | -28,87 | 251,61 | -5.235.501 | 12.901.303 | |
| 2026-03-02 |
|
4 | VRT |
Vertiv Holdings Co
Class A Common Stock |
S - Sale | -339 | 40.000 | -0,84 | 255,24 | -86.526 | 10.209.600 | |
| 2026-03-02 |
|
4 | VRT |
Vertiv Holdings Co
Class A Common Stock |
S - Sale | -2.210 | 40.339 | -5,19 | 254,70 | -562.887 | 10.274.343 | |
| 2026-03-02 |
|
4 | VRT |
Vertiv Holdings Co
Class A Common Stock |
S - Sale | -2.448 | 42.549 | -5,44 | 253,67 | -620.984 | 10.793.405 | |
| 2026-03-02 |
|
4 | VRT |
Vertiv Holdings Co
Class A Common Stock |
S - Sale | -5.003 | 44.997 | -10,01 | 252,61 | -1.263.808 | 11.366.692 | |
| 2026-03-02 |
|
4 | VRT |
Vertiv Holdings Co
Class A Common Stock |
S - Sale | -1.844 | 54.583 | -3,27 | 255,24 | -470.663 | 13.931.765 | |
| 2026-03-02 |
|
4 | VRT |
Vertiv Holdings Co
Class A Common Stock |
S - Sale | -12.098 | 56.427 | -17,65 | 254,70 | -3.081.361 | 14.371.957 | |
| 2026-03-02 |
|
4 | VRT |
Vertiv Holdings Co
Class A Common Stock |
S - Sale | -13.287 | 68.525 | -16,24 | 253,67 | -3.370.513 | 17.382.737 | |
| 2026-03-02 |
|
4 | VRT |
Vertiv Holdings Co
Class A Common Stock |
S - Sale | -27.354 | 81.812 | -25,06 | 252,61 | -6.909.894 | 20.666.529 | |
| 2026-03-02 |
|
4 | VRT |
Vertiv Holdings Co
Class A Common Stock |
S - Sale | -1.251 | 72.083 | -1,71 | 255,24 | -319.305 | 18.398.465 | |
| 2026-03-02 |
|
4 | VRT |
Vertiv Holdings Co
Class A Common Stock |
S - Sale | -8.216 | 73.334 | -10,07 | 254,70 | -2.092.615 | 18.678.170 | |
| 2026-03-02 |
|
4 | VRT |
Vertiv Holdings Co
Class A Common Stock |
S - Sale | -9.056 | 81.550 | -9,99 | 253,67 | -2.297.236 | 20.686.788 | |
| 2026-03-02 |
|
4 | VRT |
Vertiv Holdings Co
Class A Common Stock |
S - Sale | -18.561 | 90.606 | -17,00 | 252,61 | -4.688.694 | 22.887.982 | |
| 2025-12-22 |
|
4 | VRT |
Vertiv Holdings Co
Class A Common Stock |
G - Gift | 18.313 | 18.313 | |||||
| 2025-12-22 |
|
4 | VRT |
Vertiv Holdings Co
Class A Common Stock |
G - Gift | 18.313 | 18.313 | |||||
| 2025-12-22 |
|
4 | VRT |
Vertiv Holdings Co
Class A Common Stock |
G - Gift | -18.313 | 0 | -100,00 | ||||
| 2025-12-22 |
|
4 | VRT |
Vertiv Holdings Co
Class A Common Stock |
G - Gift | -18.313 | 0 | -100,00 | ||||
| 2025-12-15 |
|
4 | JBI |
Janus International Group, Inc.
Common Stock |
G - Gift | 272.797 | 752.460 | 56,87 | ||||
| 2025-12-15 |
|
4 | JBI |
Janus International Group, Inc.
Common Stock |
G - Gift | 272.797 | 752.460 | 56,87 | ||||
| 2025-12-15 |
|
4 | JBI |
Janus International Group, Inc.
Common Stock |
G - Gift | -272.797 | 213.239 | -56,13 | ||||
| 2025-12-15 |
|
4 | JBI |
Janus International Group, Inc.
Common Stock |
G - Gift | -272.797 | 213.239 | -56,13 | ||||
| 2025-12-02 |
|
4 | JBI |
Janus International Group, Inc.
Common Stock |
G - Gift | 479.663 | 479.663 | |||||
| 2025-12-02 |
|
4 | JBI |
Janus International Group, Inc.
Common Stock |
G - Gift | 479.663 | 479.663 | |||||
| 2025-12-02 |
|
4 | JBI |
Janus International Group, Inc.
Common Stock |
G - Gift | -479.663 | 345.752 | -58,11 | ||||
| 2025-12-02 |
|
4 | JBI |
Janus International Group, Inc.
Common Stock |
G - Gift | -479.663 | 345.752 | -58,11 | ||||
| 2025-06-10 |
|
4 | JBI |
Janus International Group, Inc.
Common Stock |
A - Award | 35.924 | 82.207 | 77,62 | ||||
| 2025-04-22 |
|
4 | LHX |
L3HARRIS TECHNOLOGIES, INC. /DE/
Common Stock, Par Value $1.00 |
A - Award | 887 | 6.214 | 16,65 | ||||
| 2025-03-04 |
|
4 | VRT |
Vertiv Holdings Co
Class A Common Stock |
G - Gift | 109.166 | 109.166 | |||||
| 2025-03-04 |
|
4 | VRT |
Vertiv Holdings Co
Class A Common Stock |
G - Gift | 109.167 | 109.167 | |||||
| 2025-03-04 |
|
4 | VRT |
Vertiv Holdings Co
Class A Common Stock |
G - Gift | -218.333 | 0 | -100,00 | ||||
| 2024-12-16 |
|
4 | VRT |
Vertiv Holdings Co
Class A Common Stock |
G - Gift | 50.000 | 50.000 | |||||
| 2024-12-16 |
|
4 | VRT |
Vertiv Holdings Co
Class A Common Stock |
G - Gift | 50.000 | 50.000 | |||||
| 2024-12-16 |
|
4 | VRT |
Vertiv Holdings Co
Class A Common Stock |
G - Gift | -100.000 | 0 | -100,00 | ||||
| 2024-12-13 |
|
4 | JBI |
Janus International Group, Inc.
Common Stock |
G - Gift | 486.036 | 486.036 | |||||
| 2024-12-13 |
|
4 | JBI |
Janus International Group, Inc.
Common Stock |
G - Gift | 486.036 | 486.036 | |||||
| 2024-12-13 |
|
4 | JBI |
Janus International Group, Inc.
Common Stock |
G - Gift | -972.072 | 0 | -100,00 | ||||
| 2024-12-09 |
|
4/A | JBI |
Janus International Group, Inc.
Common Stock |
G - Gift | -565.688 | 0 | -100,00 | ||||
| 2024-12-09 |
|
4/A | JBI |
Janus International Group, Inc.
Common Stock |
G - Gift | 70.171 | 321.242 | 27,95 | ||||
| 2024-12-09 |
|
4/A | JBI |
Janus International Group, Inc.
Common Stock |
G - Gift | -70.171 | 565.688 | -11,04 | ||||
| 2024-12-09 |
|
4/A | JBI |
Janus International Group, Inc.
Common Stock |
G - Gift | 515 | 2.552.731 | 0,02 | ||||
| 2024-12-09 |
|
4/A | JBI |
Janus International Group, Inc.
Common Stock |
G - Gift | -515 | 635.859 | -0,08 | ||||
| 2024-12-09 |
|
4/A | JBI |
Janus International Group, Inc.
Common Stock |
G - Gift | 6.717 | 2.552.216 | 0,26 | ||||
| 2024-12-09 |
|
4/A | JBI |
Janus International Group, Inc.
Common Stock |
G - Gift | -6.717 | 7.079 | -48,69 | ||||
| 2024-12-09 |
|
4 | JBI |
Janus International Group, Inc.
Common Stock |
J - Other | -325.415 | 0 | -100,00 | 7,56 | -2.460.137 | ||
| 2024-12-09 |
|
4 | JBI |
Janus International Group, Inc.
Common Stock |
J - Other | -325.415 | 0 | -100,00 | 7,56 | -2.460.137 | ||
| 2024-12-09 |
|
4 | JBI |
Janus International Group, Inc.
Common Stock |
J - Other | 650.830 | 972.072 | 202,60 | 7,56 | 4.920.275 | 7.348.864 | |
| 2024-12-03 |
|
4 | VRT |
Vertiv Holdings Co
Class A Common Stock |
J - Other | 100.000 | 100.000 | |||||
| 2024-12-03 |
|
4 | VRT |
Vertiv Holdings Co
Class A Common Stock |
J - Other | -50.000 | 0 | -100,00 | ||||
| 2024-12-03 |
|
4 | VRT |
Vertiv Holdings Co
Class A Common Stock |
J - Other | -50.000 | 0 | -100,00 | ||||
| 2024-11-27 |
|
4 | JBI |
Janus International Group, Inc.
Common Stock |
G - Gift | 825.415 | 825.415 | |||||
| 2024-11-27 |
|
4 | JBI |
Janus International Group, Inc.
Common Stock |
G - Gift | 825.415 | 825.415 | |||||
| 2024-11-27 |
|
4 | JBI |
Janus International Group, Inc.
Common Stock |
G - Gift | -1.650.830 | 243.839 | -87,13 | ||||
| 2024-11-05 |
|
4 | JBI |
Janus International Group, Inc.
Common Stock |
G - Gift | 325.415 | 325.415 | |||||
| 2024-11-05 |
|
4 | JBI |
Janus International Group, Inc.
Common Stock |
G - Gift | 325.415 | 325.415 | |||||
| 2024-11-05 |
|
4 | JBI |
Janus International Group, Inc.
Common Stock |
G - Gift | -650.830 | 1.894.669 | -25,57 | ||||
| 2024-06-20 |
|
4 | JBI |
Janus International Group, Inc.
Common Stock |
A - Award | 22.966 | 53.000 | 76,47 | ||||
| 2024-06-06 |
|
4 | REZI |
RESIDEO TECHNOLOGIES, INC.
Common Stock |
A - Award | 7.600 | 231.002 | 3,40 | ||||
| 2024-05-17 |
|
4 | VRT |
Vertiv Holdings Co
Class A Common Stock |
G - Gift | 50.000 | 50.000 | |||||
| 2024-05-17 |
|
4 | VRT |
Vertiv Holdings Co
Class A Common Stock |
G - Gift | 50.000 | 50.000 | |||||
| 2024-05-17 |
|
4 | VRT |
Vertiv Holdings Co
Class A Common Stock |
G - Gift | -100.000 | 0 | -100,00 | ||||
| 2024-05-17 |
|
4 | VRT |
Vertiv Holdings Co
Class A Common Stock |
S - Sale | -16.667 | 218.333 | -7,09 | 103,86 | -1.731.110 | 22.677.048 | |
| 2024-05-17 |
|
4 | VRT |
Vertiv Holdings Co
Class A Common Stock |
S - Sale | -33.333 | 100.000 | -25,00 | 103,91 | -3.463.692 | 10.391.180 | |
| 2024-04-23 |
|
4 | LHX |
L3HARRIS TECHNOLOGIES, INC. /DE/
Common Stock, Par Value $1.00 |
A - Award | 924 | 5.307 | 21,08 | ||||
| 2024-02-13 |
|
4 | JBI |
Janus International Group, Inc.
Common Stock |
G - Gift | -636.374 | 0 | -100,00 | ||||
| 2023-07-05 |
|
4 | JBI |
Janus International Group, Inc.
Common Stock |
A - Award | 1.953 | 30.034 | 6,95 | ||||
| 2023-07-05 |
|
4 | REZI |
RESIDEO TECHNOLOGIES, INC.
Common Stock |
A - Award | 9.158 | 223.402 | 4,27 | ||||
| 2023-06-08 |
|
4 | JBI |
Janus International Group, Inc.
Common Stock |
A - Award | 14.285 | 28.081 | 103,54 | ||||
| 2023-04-25 |
|
4 | LHX |
L3HARRIS TECHNOLOGIES, INC. /DE/
Common Stock, Par Value $1.00 |
M - Exercise | 699 | 4.363 | 19,09 | ||||
| 2023-04-25 |
|
4 | LHX |
L3HARRIS TECHNOLOGIES, INC. /DE/
Common Stock, Par Value $1.00 |
A - Award | 841 | 3.664 | 29,79 | ||||
| 2022-06-10 |
|
4 | REZI |
RESIDEO TECHNOLOGIES, INC.
Common Stock |
M - Exercise | 4.070 | 214.244 | 1,94 | ||||
| 2022-06-10 |
|
4 | REZI |
RESIDEO TECHNOLOGIES, INC.
Common Stock |
A - Award | 6.280 | 210.174 | 3,08 | ||||
| 2022-06-08 |
|
4 | JBI |
Janus International Group, Inc.
Common Stock |
A - Award | 7.079 | 13.796 | 105,39 | ||||
| 2022-05-04 |
|
4 | LHX |
L3HARRIS TECHNOLOGIES, INC. /DE/
2021 Director Share Units |
M - Exercise | -795 | 0 | -100,00 | ||||
| 2022-05-04 |
|
4 | LHX |
L3HARRIS TECHNOLOGIES, INC. /DE/
Common Stock, Par Value $1.00 |
M - Exercise | 795 | 2.823 | 39,23 | ||||
| 2022-05-04 |
|
4 | LHX |
L3HARRIS TECHNOLOGIES, INC. /DE/
2022 Director Share Units |
A - Award | 685 | 685 | |||||
| 2022-03-07 |
|
4 | VRT |
Vertiv Holdings Co
Stock Options |
A - Award | 38.647 | 38.647 | |||||
| 2022-01-06 |
|
4 | JBI |
Janus International Group, Inc.
Common Stock |
A - Award | 6.717 | 6.717 | |||||
| 2021-11-18 |
|
4 | REZI |
RESIDEO TECHNOLOGIES, INC.
Restricted Stock Units |
M - Exercise | -5.578 | 5.579 | -50,00 | ||||
| 2021-11-18 |
|
4 | REZI |
RESIDEO TECHNOLOGIES, INC.
Common Stock |
M - Exercise | 5.578 | 198.315 | 2,89 | ||||
| 2021-11-16 |
|
4 | JBI |
Janus International Group, Inc.
Warrants |
M - Exercise | -205.000 | 0 | -100,00 | ||||
| 2021-11-16 |
|
4 | JBI |
Janus International Group, Inc.
Warrants |
M - Exercise | -820.000 | 0 | -100,00 | ||||
| 2021-11-16 |
|
4 | JBI |
Janus International Group, Inc.
Common Stock |
F - Taxes | -143.500 | 636.374 | -18,40 | ||||
| 2021-11-16 |
|
4 | JBI |
Janus International Group, Inc.
Common Stock |
M - Exercise | 205.000 | 779.874 | 35,66 | ||||
| 2021-11-16 |
|
4 | JBI |
Janus International Group, Inc.
Common Stock |
F - Taxes | -574.000 | 2.545.499 | -18,40 | ||||
| 2021-11-16 |
|
4 | JBI |
Janus International Group, Inc.
Common Stock, par value $0.0001 per share ("Common Stock") |
M - Exercise | 820.000 | 3.119.499 | 35,66 | ||||
| 2021-09-01 |
|
4 | JBI |
Janus International Group, Inc.
Common Stock |
S - Sale | -82.784 | 2.299.499 | -3,47 | 14,98 | -1.240.104 | 34.446.495 | |
| 2021-09-01 |
|
4 | JBI |
Janus International Group, Inc.
Common Stock, par value $0.0001 per share ("Common Stock") |
S - Sale | -417.216 | 2.382.283 | -14,90 | 14,87 | -6.204.002 | 35.424.548 | |
| 2021-08-24 |
|
4 | JBI |
Janus International Group, Inc.
Common Stock, par value $0.0001 per share ("Common Stock") |
S - Sale | -133.200 | 2.799.499 | -4,54 | 14,68 | -1.955.376 | 41.096.645 | |
| 2021-08-20 |
|
4 | JBI |
Janus International Group, Inc.
Common Stock |
S - Sale | -240.000 | 2.932.699 | -7,56 | 14,84 | -3.561.600 | 43.521.253 | |
| 2021-08-20 |
|
4 | JBI |
Janus International Group, Inc.
Common Stock |
S - Sale | -80.000 | 3.172.699 | -2,46 | 14,23 | -1.138.400 | 45.147.507 | |
| 2021-08-20 |
|
4 | JBI |
Janus International Group, Inc.
Common Stock, par value $0.0001 per share ("Common Stock") |
S - Sale | -46.800 | 3.252.699 | -1,42 | 13,91 | -650.988 | 45.245.043 | |
| 2021-06-10 |
|
4 | REZI |
RESIDEO TECHNOLOGIES, INC.
Restricted Stock Units |
A - Award | 4.070 | 4.070 | |||||
| 2021-06-10 |
|
4 | REZI |
RESIDEO TECHNOLOGIES, INC.
Restricted Stock Units |
M - Exercise | -12.172 | 0 | -100,00 | ||||
| 2021-06-10 |
|
4 | REZI |
RESIDEO TECHNOLOGIES, INC.
Common Stock |
M - Exercise | 12.172 | 192.737 | 6,74 | ||||
| 2021-06-09 |
|
4 | JIH |
Juniper Industrial Holdings, Inc.
Warrant |
J - Other | -10.150.000 | 0 | -100,00 | ||||
| 2021-06-09 |
|
4 | JIH |
Juniper Industrial Holdings, Inc.
Class B Common Stock |
C - Conversion | -8.520.000 | 0 | -100,00 | ||||
| 2021-06-07 | 3 | JBI |
Janus International Group, Inc.
Common Stock, par value $0.0001 per share |
8.520.000 | ||||||||
| 2021-06-07 | 3 | JBI |
Janus International Group, Inc.
Common Stock, par value $0.0001 per share |
1.000.000 | ||||||||
| 2021-04-27 |
|
4 | LHX |
L3HARRIS TECHNOLOGIES, INC. /DE/
2020 Director Share Units |
M - Exercise | -885 | 0 | -100,00 | ||||
| 2021-04-27 |
|
4 | LHX |
L3HARRIS TECHNOLOGIES, INC. /DE/
Common Stock, Par Value $1.00 |
M - Exercise | 885 | 2.028 | 77,50 | ||||
| 2021-04-27 |
|
4 | LHX |
L3HARRIS TECHNOLOGIES, INC. /DE/
2021 Director Share Units |
A - Award | 781 | 781 | |||||
| 2021-03-17 |
|
4 | VRT |
Vertiv Holdings Co
Redeemable warrants |
M - Exercise | -33.333 | 0 | -100,00 | ||||
| 2021-03-17 |
|
4 | VRT |
Vertiv Holdings Co
Class A common stock |
M - Exercise | 33.333 | 368.333 | 9,95 | ||||
| 2021-02-08 |
|
4 | VRT |
Vertiv Holdings Co
Stock Options |
A - Award | 38.647 | 38.647 | |||||
| 2020-11-19 |
|
4 | REZI |
RESIDEO TECHNOLOGIES, INC.
Common Stock |
P - Purchase | 6.666 | 180.565 | 3,83 | 15,00 | 99.990 | 2.708.475 | |
| 2020-10-27 |
|
4 | LHX |
L3HARRIS TECHNOLOGIES, INC. /DE/
Director Share Units |
M - Exercise | -417 | 0 | -100,00 | ||||
| 2020-10-27 |
|
4 | LHX |
L3HARRIS TECHNOLOGIES, INC. /DE/
Common Stock, Par Value $1.00 |
M - Exercise | 417 | 1.142 | 57,56 | ||||
| 2020-06-15 |
|
4 | REZI |
RESIDEO TECHNOLOGIES, INC.
Restricted Stock Units |
M - Exercise | -5.799 | 0 | -100,00 | ||||
| 2020-06-15 |
|
4 | REZI |
RESIDEO TECHNOLOGIES, INC.
Common Stock |
M - Exercise | 5.799 | 173.899 | 3,45 | ||||
| 2020-06-12 |
|
4 | LHX |
L3HARRIS TECHNOLOGIES, INC. /DE/
Common Stock, Par Value $1.00 |
S - Sale | -14 | 185 | -7,04 | 189,82 | -2.657 | 35.117 | |
| 2020-06-12 |
|
4 | LHX |
L3HARRIS TECHNOLOGIES, INC. /DE/
Common Stock, Par Value $1.00 |
P - Purchase | 161 | 199 | 423,68 | 191,45 | 30.823 | 38.099 | |
| 2020-06-12 |
|
4 | LHX |
L3HARRIS TECHNOLOGIES, INC. /DE/
Common Stock, Par Value $1.00 |
S - Sale | -243 | 38 | -86,48 | 148,22 | -36.017 | 5.632 | |
| 2020-06-12 |
|
4 | LHX |
L3HARRIS TECHNOLOGIES, INC. /DE/
Common Stock, Par Value $1.00 |
P - Purchase | 16 | 281 | 6,04 | 161,37 | 2.582 | 45.345 | |
| 2020-06-12 |
|
4 | LHX |
L3HARRIS TECHNOLOGIES, INC. /DE/
Common Stock, Par Value $1.00 |
P - Purchase | 10 | 265 | 3,92 | 211,66 | 2.117 | 56.090 | |
| 2020-06-12 |
|
4 | LHX |
L3HARRIS TECHNOLOGIES, INC. /DE/
Common Stock, Par Value $1.00 |
S - Sale | -11 | 255 | -4,14 | 197,30 | -2.170 | 50.312 | |
| 2020-06-12 |
|
4 | LHX |
L3HARRIS TECHNOLOGIES, INC. /DE/
Common Stock, Par Value $1.00 |
P - Purchase | 21 | 266 | 8,57 | 192,93 | 4.052 | 51.319 | |
| 2020-06-12 |
|
4 | LHX |
L3HARRIS TECHNOLOGIES, INC. /DE/
Common Stock, Par Value $1.00 |
P - Purchase | 9 | 245 | 3,81 | 208,80 | 1.879 | 51.156 | |
| 2020-06-12 |
|
4 | LHX |
L3HARRIS TECHNOLOGIES, INC. /DE/
Common Stock, Par Value $1.00 |
P - Purchase | 11 | 236 | 4,89 | 213,23 | 2.346 | 50.322 | |
| 2020-06-12 |
|
4 | LHX |
L3HARRIS TECHNOLOGIES, INC. /DE/
Common Stock, Par Value $1.00 |
P - Purchase | 53 | 225 | 30,81 | 201,17 | 10.662 | 45.263 | |
| 2020-06-12 |
|
4 | LHX |
L3HARRIS TECHNOLOGIES, INC. /DE/
Common Stock, Par Value $1.00 |
P - Purchase | 58 | 172 | 50,88 | 193,74 | 11.237 | 33.323 | |
| 2020-06-12 |
|
4 | LHX |
L3HARRIS TECHNOLOGIES, INC. /DE/
Common Stock, Par Value $1.00 |
P - Purchase | 114 | 114 | 185,01 | 21.091 | 21.091 | ||
| 2020-06-09 |
|
4 | REZI |
RESIDEO TECHNOLOGIES, INC.
Restricted Stock Units |
A - Award | 12.172 | 12.172 | 9,86 | 120.016 | 120.016 | ||
| 2020-06-08 |
|
4 | REZI |
RESIDEO TECHNOLOGIES, INC.
Common Stock |
P - Purchase | 69.726 | 168.100 | 70,88 | 9,38 | 654.030 | 1.576.778 | |
| 2020-06-08 |
|
4 | REZI |
RESIDEO TECHNOLOGIES, INC.
Common Stock |
P - Purchase | 40.134 | 98.374 | 68,91 | 8,57 | 343.948 | 843.065 | |
| 2020-04-28 |
|
4 | LHX |
L3HARRIS TECHNOLOGIES, INC. /DE/
Director Share Units |
A - Award | 869 | 869 | 189,85 | 164.980 | 164.980 | ||
| 2020-03-24 |
|
4 | JIH |
Juniper Industrial Holdings, Inc.
Class B common stock |
S - Sale | -35.000 | 8.520.000 | -0,41 | 0,00 | -105 | 25.560 | |
| 2020-02-11 |
|
4 | VRT |
Vertiv Holdings Co
Stock Option |
A - Award | 38.647 | 38.647 | |||||
| 2020-02-11 |
|
4 | VRT |
Vertiv Holdings Co
Redeemable warrants |
A - Award | 33.333 | 33.333 | |||||
| 2020-02-11 |
|
4 | VRT |
Vertiv Holdings Co
Class B common stock |
C - Conversion | -35.000 | 35.000 | -50,00 | ||||
| 2020-02-11 |
|
4 | VRT |
Vertiv Holdings Co
Class A common stock |
C - Conversion | 35.000 | 335.000 | 11,67 | ||||
| 2020-02-11 |
|
4 | VRT |
Vertiv Holdings Co
Class A common stock |
A - Award | 200.000 | 300.000 | 200,00 | 10,00 | 2.000.000 | 3.000.000 | |
| 2020-01-31 |
|
4 | MSM |
MSC INDUSTRIAL DIRECT CO INC
Dividend Equivalent Unit |
M - Exercise | -20 | 21 | -48,78 | ||||
| 2020-01-31 |
|
4 | MSM |
MSC INDUSTRIAL DIRECT CO INC
Restricted Stock Units (RSU) |
M - Exercise | -717 | 718 | -49,97 | ||||
| 2020-01-31 |
|
4 | MSM |
MSC INDUSTRIAL DIRECT CO INC
Class A Common Stock, $0.001 par value |
M - Exercise | 20 | 38.303 | 0,05 | ||||
| 2020-01-31 |
|
4 | MSM |
MSC INDUSTRIAL DIRECT CO INC
Class A Common Stock, $0.001 par value |
M - Exercise | 717 | 38.283 | 1,91 | ||||
| 2020-01-28 |
|
4 | MSM |
MSC INDUSTRIAL DIRECT CO INC
Dividend Equivalent Unit |
M - Exercise | -34 | 42 | -44,74 | ||||
| 2020-01-28 |
|
4 | MSM |
MSC INDUSTRIAL DIRECT CO INC
Restricted Stock Units (RSU) |
M - Exercise | -581 | 0 | -100,00 | ||||
| 2020-01-28 |
|
4 | MSM |
MSC INDUSTRIAL DIRECT CO INC
Class A Common Stock, $0.001 par value |
M - Exercise | 34 | 37.566 | 0,09 | ||||
| 2020-01-28 |
|
4 | MSM |
MSC INDUSTRIAL DIRECT CO INC
Class A Common Stock, $0.001 par value |
M - Exercise | 581 | 37.532 | 1,57 | ||||
| 2020-01-06 |
|
4 | MSM |
MSC INDUSTRIAL DIRECT CO INC
Dividend Equivalent Unit |
A - Award | 21 | 76 | 37,90 | ||||
| 2019-11-19 |
|
4 | REZI |
RESIDEO TECHNOLOGIES, INC.
Restricted Stock Units |
M - Exercise | -5.578 | 0 | -100,00 | ||||
| 2019-11-19 |
|
4 | REZI |
RESIDEO TECHNOLOGIES, INC.
Common Stock |
M - Exercise | 5.578 | 58.240 | 10,59 | ||||
| 2019-11-18 |
|
4 | REZI |
RESIDEO TECHNOLOGIES, INC.
Common Stock |
P - Purchase | 25.000 | 52.662 | 90,38 | 9,44 | 236.000 | 497.129 | |
| 2019-10-29 |
|
4 | LHX |
L3HARRIS TECHNOLOGIES, INC. /DE/
Director Share Units |
A - Award | 410 | 410 | 200,96 | 82.394 | 82.394 | ||
| 2019-08-20 |
|
4 | MSM |
MSC INDUSTRIAL DIRECT CO INC
Dividend Equivalent Unit |
A - Award | 23 | 55 | 70,15 | ||||
| 2019-07-11 |
|
4 | LHX |
L3HARRIS TECHNOLOGIES, INC. /DE/
Phantom Stock Units |
D - Sale to Issuer | -2.757 | 0 | -100,00 | 189,13 | -521.458 | ||
| 2019-07-01 |
|
4 | LHX |
L3HARRIS TECHNOLOGIES, INC. /DE/
Phantom Stock Units |
A - Award | 187 | 2.757 | 7,29 | 189,13 | 35.452 | 521.458 | |
| 2019-06-13 |
|
4 | REZI |
RESIDEO TECHNOLOGIES, INC.
Restricted Stock Units |
A - Award | 5.799 | 5.799 | 20,69 | 119.981 | 119.981 | ||
| 2019-05-21 |
|
4 | MSM |
MSC INDUSTRIAL DIRECT CO INC
Dividend Equivalent Unit |
A - Award | 15 | 32 | 93,25 | ||||
| 2019-05-07 |
|
4 | PBI |
PITNEY BOWES INC /DE/
Restricted Stock Units |
A - Award | 17.301 | 17.301 | 5,78 | 100.000 | 100.000 | ||
| 2019-05-07 |
|
4 | PBI |
PITNEY BOWES INC /DE/
Restricted Stock Units |
M - Exercise | -11.351 | 0 | -100,00 | ||||
| 2019-05-07 |
|
4 | PBI |
PITNEY BOWES INC /DE/
Common Stock |
A - Award | 11.351 | 44.298 | 34,45 | ||||
| 2019-04-02 |
|
4 | HRS |
HARRIS CORP /DE/
Phantom Stock Units |
A - Award | 222 | 2.560 | 9,49 | 163,30 | 36.249 | 418.077 | |
| 2019-03-14 |
|
4 | REZI |
RESIDEO TECHNOLOGIES, INC.
Common Stock |
P - Purchase | 25.000 | 27.662 | 939,14 | 20,41 | 510.162 | 564.485 | |
| 2019-03-14 | 3/A | REZI |
RESIDEO TECHNOLOGIES, INC.
Common Stock |
2.662 | ||||||||
| 2019-03-14 | 3/A | REZI |
RESIDEO TECHNOLOGIES, INC.
Common Stock |
8 | ||||||||
| 2019-01-30 |
|
4 | MSM |
MSC INDUSTRIAL DIRECT CO INC
Restricted Stock Units (RSU) |
A - Award | 1.435 | 1.435 | |||||
| 2019-01-29 |
|
4 | MSM |
MSC INDUSTRIAL DIRECT CO INC
Dividend Equivalent Units (DEU) |
M - Exercise | -29 | 17 | -63,04 | ||||
| 2019-01-29 |
|
4 | MSM |
MSC INDUSTRIAL DIRECT CO INC
Restricted Stock Units (RSU) |
M - Exercise | -555 | 0 | -100,00 | ||||
| 2019-01-29 |
|
4 | MSM |
MSC INDUSTRIAL DIRECT CO INC
Class A Common Stock, $0.001 par value |
M - Exercise | 29 | 36.951 | 0,08 | ||||
| 2019-01-29 |
|
4 | MSM |
MSC INDUSTRIAL DIRECT CO INC
Class A Common Stock, $0.001 par value |
M - Exercise | 555 | 36.922 | 1,53 | ||||
| 2019-01-29 |
|
4 | MSM |
MSC INDUSTRIAL DIRECT CO INC
Dividend Equivalent Units (DEU) |
M - Exercise | -16 | 46 | -25,81 | ||||
| 2019-01-29 |
|
4 | MSM |
MSC INDUSTRIAL DIRECT CO INC
Restricted Stock Units (RSU) |
M - Exercise | -580 | 581 | -49,96 | ||||
| 2019-01-29 |
|
4 | MSM |
MSC INDUSTRIAL DIRECT CO INC
Class A Common Stock, $0.001 par value |
M - Exercise | 16 | 36.367 | 0,04 | ||||
| 2019-01-29 |
|
4 | MSM |
MSC INDUSTRIAL DIRECT CO INC
Class A Common Stock, $0.001 par value |
M - Exercise | 580 | 36.351 | 1,62 | ||||
| 2019-01-29 |
|
4 | MSM |
MSC INDUSTRIAL DIRECT CO INC
Dividend Equivalent Unit |
A - Award | 13 | 63 | 26,96 | ||||
| 2019-01-04 |
|
4 | MSM |
MSC INDUSTRIAL DIRECT CO INC
Dividend Equivalent Unit |
A - Award | 13 | 50 | 34,35 | ||||
| 2019-01-03 |
|
4 | HRS |
HARRIS CORP /DE/
Phantom Stock Units |
A - Award | 269 | 2.328 | 13,07 | 134,65 | 36.250 | 313.507 | |
| 2018-11-19 |
|
4 | REZI |
RESIDEO TECHNOLOGIES, INC.
Restricted Stock Units |
A - Award | 11.157 | 11.157 | |||||
| 2018-11-19 |
|
4 | REZI |
RESIDEO TECHNOLOGIES, INC.
Restricted Stock Units |
A - Award | 5.578 | 5.578 | |||||
| 2018-10-03 |
|
4 | HRS |
HARRIS CORP /DE/
Phantom Stock Units |
A - Award | 215 | 2.049 | 11,72 | 168,57 | 36.249 | 345.466 | |
| 2018-08-21 |
|
4 | MSM |
MSC INDUSTRIAL DIRECT CO INC
Dividend Equivalent Unit |
A - Award | 12 | 37 | 49,88 | ||||
| 2018-07-03 |
|
4 | HRS |
HARRIS CORP /DE/
Phantom Stock Units |
A - Award | 268 | 1.827 | 17,20 | 144,54 | 38.750 | 264.017 | |
| 2018-06-12 |
|
4 | GSAH |
GS Acquisition Holdings Corp
Class A common stock |
P - Purchase | 100.000 | 100.000 | |||||
| 2018-05-21 |
|
4 | MSM |
MSC INDUSTRIAL DIRECT CO INC
Dividend Equivalent Unit |
A - Award | 12 | 25 | 86,14 | ||||
| 2018-05-08 |
|
4 | PBI |
PITNEY BOWES INC /DE/
Common Stock |
A - Award | 6.309 | 31.389 | 25,16 | ||||
| 2018-05-08 |
|
4 | PBI |
PITNEY BOWES INC /DE/
Restricted Stock Units |
A - Award | 11.351 | 11.351 | 8,81 | 100.002 | 100.002 | ||
| 2018-05-08 |
|
4 | PBI |
PITNEY BOWES INC /DE/
Restricted Stock Units |
M - Exercise | -6.309 | 0 | -100,00 | ||||
| 2018-04-03 |
|
4 | HRS |
HARRIS CORP /DE/
Phantom Stock Units |
A - Award | 209 | 1.553 | 15,58 | 161,28 | 33.749 | 250.431 | |
| 2018-02-15 |
|
4 | MSM |
MSC INDUSTRIAL DIRECT CO INC
Dividend Equivalent Unit |
A - Award | 3 | 13 | 36,01 | ||||
| 2018-01-29 |
|
4 | MSM |
MSC INDUSTRIAL DIRECT CO INC
Dividend Equivalent Units (DEU) |
M - Exercise | -10 | 10 | -48,83 | ||||
| 2018-01-29 |
|
4 | MSM |
MSC INDUSTRIAL DIRECT CO INC
Restricted Stock Units (RSU) |
M - Exercise | -555 | 1.716 | -24,44 | ||||
| 2018-01-29 |
|
4 | MSM |
MSC INDUSTRIAL DIRECT CO INC
Class A Common Stock, $0.001 par value |
M - Exercise | 9 | 35.771 | 0,03 | ||||
| 2018-01-29 |
|
4 | MSM |
MSC INDUSTRIAL DIRECT CO INC
Class A Common Stock, $0.001 par value |
M - Exercise | 555 | 35.762 | 1,58 | ||||
| 2018-01-29 |
|
4 | MSM |
MSC INDUSTRIAL DIRECT CO INC
Restricted Stock Units (RSU) |
A - Award | 1.161 | 2.271 | 104,59 | ||||
| 2018-01-23 |
|
4 | MSM |
MSC INDUSTRIAL DIRECT CO INC
Dividend Equivalent Units (DEU) |
M - Exercise | -38 | 19 | -66,67 | ||||
| 2018-01-23 |
|
4 | MSM |
MSC INDUSTRIAL DIRECT CO INC
Restricted Stock Units (RSU) |
M - Exercise | -982 | 1.110 | -46,94 | ||||
| 2018-01-23 |
|
4 | MSM |
MSC INDUSTRIAL DIRECT CO INC
Class A Common Stock, $0.001 par value |
M - Exercise | 38 | 35.207 | 0,11 | ||||
| 2018-01-23 |
|
4 | MSM |
MSC INDUSTRIAL DIRECT CO INC
Class A Common Stock, $0.001 par value |
M - Exercise | 982 | 35.169 | 2,87 | ||||
| 2018-01-03 |
|
4 | HRS |
HARRIS CORP /DE/
Phantom Stock Units |
A - Award | 238 | 1.339 | 21,65 | 141,65 | 33.750 | 189.614 | |
| 2017-12-21 |
|
4 | MSM |
MSC INDUSTRIAL DIRECT CO INC
Dividend Equivalent Unit |
A - Award | 12 | 57 | 27,30 | ||||
| 2017-10-03 |
|
4 | HRS |
HARRIS CORP /DE/
Phantom Stock Units |
A - Award | 256 | 1.096 | 30,53 | 131,68 | 33.750 | 144.308 | |
| 2017-08-04 |
|
4 | MSM |
MSC INDUSTRIAL DIRECT CO INC
Dividend Equivalent Unit |
A - Award | 13 | 45 | 42,76 | ||||
| 2017-07-05 |
|
4 | HRS |
HARRIS CORP /DE/
Phantom Stock Units |
A - Award | 309 | 836 | 58,79 | 109,08 | 33.750 | 91.159 | |
| 2017-05-09 |
|
4 | PBI |
PITNEY BOWES INC /DE/
Restricted Stock Units |
A - Award | 6.309 | 6.309 | 15,85 | 99.998 | 99.998 | ||
| 2017-05-09 |
|
4 | PBI |
PITNEY BOWES INC /DE/
Restricted Stock Units |
M - Exercise | -5.485 | 0 | -100,00 | ||||
| 2017-05-09 |
|
4 | PBI |
PITNEY BOWES INC /DE/
Common Stock |
M - Exercise | 5.485 | 24.113 | 29,44 | ||||
| 2017-05-09 |
|
4 | MSM |
MSC INDUSTRIAL DIRECT CO INC
Dividend Equivalent Unit |
A - Award | 11 | 32 | 50,98 | ||||
| 2017-04-04 |
|
4 | HRS |
HARRIS CORP /DE/
Phantom Stock Units |
A - Award | 303 | 524 | 137,48 | 111,27 | 33.750 | 58.300 | |
| 2017-02-16 |
|
4 | HON |
HONEYWELL INTERNATIONAL INC
Restricted Units |
M - Exercise | -27.561 | 0 | -100,00 | 123,82 | -3.412.603 | ||
| 2017-02-16 |
|
4 | HON |
HONEYWELL INTERNATIONAL INC
Common Stock |
F - Taxes | -14.209 | 144.296 | -8,96 | 123,82 | -1.759.358 | 17.866.731 | |
| 2017-02-16 |
|
4 | HON |
HONEYWELL INTERNATIONAL INC
Common Stock |
M - Exercise | 27.561 | 158.505 | 21,05 | 123,82 | 3.412.603 | 19.626.089 | |
| 2017-02-08 |
|
4 | MSM |
MSC INDUSTRIAL DIRECT CO INC
Dividend Equivalent Unit |
A - Award | 4 | 21 | 26,72 | ||||
| 2017-01-27 |
|
4 | MSM |
MSC INDUSTRIAL DIRECT CO INC
Restricted Stock Unit |
A - Award | 1.110 | 2.092 | 113,03 | ||||
| 2017-01-23 |
|
4 | MSM |
MSC INDUSTRIAL DIRECT CO INC
Dividend Equivalent Units (DEU) |
M - Exercise | -16 | 16 | -50,00 | ||||
| 2017-01-23 |
|
4 | MSM |
MSC INDUSTRIAL DIRECT CO INC
Restricted Stock Units (RSU) |
M - Exercise | -982 | 982 | -50,00 | ||||
| 2017-01-23 |
|
4 | MSM |
MSC INDUSTRIAL DIRECT CO INC
Class A Common Stock, $0.001 par value |
M - Exercise | 16 | 34.187 | 0,05 | ||||
| 2017-01-23 |
|
4 | MSM |
MSC INDUSTRIAL DIRECT CO INC
Class A Common Stock, $0.001 par value |
M - Exercise | 982 | 34.171 | 2,96 | ||||
| 2017-01-03 |
|
4 | HRS |
HARRIS CORP /DE/
Phantom Stock Units |
A - Award | 220 | 220 | 102,47 | 22.500 | 22.500 | ||
| 2016-12-22 |
|
4 | MSM |
MSC INDUSTRIAL DIRECT CO INC
Dividend Equivalent Unit |
A - Award | 10 | 33 | 44,02 | ||||
| 2016-11-03 |
|
4 | HRS |
HARRIS CORP /DE/
Common Stock, Par Value $1.00 |
A - Award | 725 | 725 | |||||
| 2016-10-31 | 3 | HRS |
HARRIS CORP /DE/
No Securities Beneficially Owned |
0 | ||||||||
| 2016-08-17 |
|
4 | MSM |
MSC INDUSTRIAL DIRECT CO INC
Dividend Equivalent Unit |
A - Award | 12 | 23 | 107,29 | ||||
| 2016-06-03 |
|
4 | MSM |
MSC INDUSTRIAL DIRECT CO INC
Dividend Equivalent Unit |
A - Award | 11 | 11 | |||||
| 2016-05-10 |
|
4 | PBI |
PITNEY BOWES INC /DE/
Restricted Stock Units |
A - Award | 5.485 | 5.485 | 18,23 | 99.992 | 99.992 | ||
| 2016-05-10 |
|
4 | PBI |
PITNEY BOWES INC /DE/
Restricted Stock Units |
M - Exercise | -4.403 | 0 | -100,00 | ||||
| 2016-05-10 |
|
4 | PBI |
PITNEY BOWES INC /DE/
Common Stock |
M - Exercise | 4.403 | 18.356 | 31,56 | ||||
| 2016-04-19 |
|
4 | HON |
HONEYWELL INTERNATIONAL INC
Stock Option (right to buy) |
M - Exercise | -275.000 | 0 | -100,00 | ||||
| 2016-04-19 |
|
4 | HON |
HONEYWELL INTERNATIONAL INC
Common Stock |
S - Sale | -188.420 | 130.944 | -59,00 | 115,12 | -21.690.910 | 15.074.273 | |
| 2016-04-19 |
|
4 | HON |
HONEYWELL INTERNATIONAL INC
Common Stock |
M - Exercise | X | 275.000 | 319.364 | 619,87 | 40,17 | 11.046.750 | 12.828.852 |
| 2016-02-29 |
|
4 | HON |
HONEYWELL INTERNATIONAL INC
Employee Stock Options |
A - Award | 180.000 | 180.000 | |||||
| 2016-02-11 |
|
4 | HON |
HONEYWELL INTERNATIONAL INC
Common Stock |
S - Sale | -31.384 | 44.364 | -41,43 | 102,77 | -3.225.334 | 4.559.288 | |
| 2016-01-22 |
|
4 | MSM |
MSC INDUSTRIAL DIRECT CO INC
Restricted Stock Unit |
A - Award | 1.964 | 1.964 | |||||
| 2015-11-03 |
|
4 | HON |
HONEYWELL INTERNATIONAL INC
Common Stock |
S - Sale | -41.398 | 75.640 | -35,37 | 103,77 | -4.295.870 | 7.849.163 | |
| 2015-07-28 |
|
4 | HON |
HONEYWELL INTERNATIONAL INC
Restricted Units |
M - Exercise | -37.278 | 0 | -100,00 | 102,56 | -3.823.232 | ||
| 2015-07-28 |
|
4 | HON |
HONEYWELL INTERNATIONAL INC
Common Stock |
F - Taxes | -19.225 | 116.943 | -14,12 | 102,56 | -1.971.716 | 11.993.674 | |
| 2015-07-28 |
|
4 | HON |
HONEYWELL INTERNATIONAL INC
Common Stock |
M - Exercise | 37.278 | 136.168 | 37,70 | 102,56 | 3.823.232 | 13.965.390 | |
| 2015-07-24 |
|
4 | HON |
HONEYWELL INTERNATIONAL INC
Common Stock |
S - Sale | -70.926 | 98.890 | -41,77 | 105,00 | -7.447.230 | 10.383.450 | |
| 2015-06-15 |
|
4 | HON |
HONEYWELL INTERNATIONAL INC
Supplemental Savings Plan Interests |
A - Award | 17 | 11.036 | 0,16 | 104,05 | 1.812 | 1.148.316 | |
| 2015-06-01 |
|
4 | HON |
HONEYWELL INTERNATIONAL INC
Supplemental Savings Plan Interests |
A - Award | 17 | 11.019 | 0,16 | 104,20 | 1.812 | 1.148.158 | |
| 2015-05-18 |
|
4 | HON |
HONEYWELL INTERNATIONAL INC
Supplemental Savings Plan Interests |
A - Award | 17 | 10.948 | 0,16 | 106,85 | 1.812 | 1.169.778 | |
| 2015-05-12 |
|
4 | PBI |
PITNEY BOWES INC /DE/
Restricted Stock Units |
A - Award | 4.403 | 4.403 | 22,71 | 99.992 | 99.992 | ||
| 2015-05-12 |
|
4 | PBI |
PITNEY BOWES INC /DE/
Restricted Stock Units |
M - Exercise | 3.816 | 0 | -100,00 | ||||
| 2015-05-12 |
|
4 | PBI |
PITNEY BOWES INC /DE/
Common Stock |
M - Exercise | 3.816 | 13.813 | 38,17 | ||||
| 2015-05-04 |
|
4 | HON |
HONEYWELL INTERNATIONAL INC
Supplemental Savings Plan Interests |
A - Award | 18 | 10.931 | 0,16 | 102,50 | 1.811 | 1.120.418 | |
| 2015-04-21 |
|
4 | HON |
HONEYWELL INTERNATIONAL INC
Supplemental Savings Plan Interests |
A - Award | 18 | 10.913 | 0,16 | 101,70 | 1.811 | 1.109.875 | |
| 2015-04-06 |
|
4 | HON |
HONEYWELL INTERNATIONAL INC
Supplemental Savings Plan Interests |
A - Award | 18 | 10.895 | 0,16 | 103,51 | 1.812 | 1.127.785 | |
| 2015-03-23 |
|
4 | HON |
HONEYWELL INTERNATIONAL INC
Supplemental Savings Plan Interests |
A - Award | 17 | 10.878 | 0,16 | 105,40 | 1.812 | 1.146.532 | |
| 2015-03-09 |
|
4 | HON |
HONEYWELL INTERNATIONAL INC
Supplemental Savings Plan Interests |
A - Award | 18 | 10.861 | 0,16 | 101,87 | 1.811 | 1.106.382 | |
| 2015-03-02 |
|
4 | HON |
HONEYWELL INTERNATIONAL INC
Employee Stock Options |
A - Award | 180.000 | 180.000 | |||||
| 2015-02-23 |
|
4 | HON |
HONEYWELL INTERNATIONAL INC
Supplemental Savings Plan Interests |
A - Award | 17 | 10.789 | 0,16 | 105,36 | 1.811 | 1.136.772 | |
| 2015-02-09 |
|
4 | HON |
HONEYWELL INTERNATIONAL INC
Supplemental Savings Plan Interests |
A - Award | 18 | 10.772 | 0,17 | 101,75 | 1.811 | 1.096.073 | |
| 2015-02-04 |
|
4 | HON |
HONEYWELL INTERNATIONAL INC
Stock Option (right to buy) |
M - Exercise | -50.000 | 0 | -100,00 | ||||
| 2015-02-04 |
|
4 | HON |
HONEYWELL INTERNATIONAL INC
Common Stock |
S - Sale | -39.968 | 169.816 | -19,05 | 100,03 | -3.997.999 | 16.986.694 | |
| 2015-02-04 |
|
4 | HON |
HONEYWELL INTERNATIONAL INC
Common Stock |
M - Exercise | X | 50.000 | 209.784 | 31,29 | 58,48 | 2.924.000 | 12.268.168 |
| 2015-02-04 |
|
4 | HON |
HONEYWELL INTERNATIONAL INC
Stock Option (right to buy) |
M - Exercise | -110.000 | 50.000 | -68,75 | ||||
| 2015-02-04 |
|
4 | HON |
HONEYWELL INTERNATIONAL INC
Common Stock |
S - Sale | -88.648 | 159.784 | -35,68 | 97,75 | -8.665.342 | 15.618.886 | |
| 2015-02-04 |
|
4 | HON |
HONEYWELL INTERNATIONAL INC
Common Stock |
M - Exercise | X | 110.000 | 248.432 | 79,46 | 58,48 | 6.432.800 | 14.528.303 |
| 2015-01-26 |
|
4 | HON |
HONEYWELL INTERNATIONAL INC
Supplemental Savings Plan Interests |
A - Award | 18 | 10.754 | 0,16 | 102,50 | 1.811 | 1.102.328 | |
| 2015-01-20 |
|
4 | MSM |
MSC INDUSTRIAL DIRECT CO INC
Class A Common Stock, $0.001 par value |
A - Award | 1.547 | 33.189 | 4,89 | ||||
| 2014-12-29 |
|
4 | HON |
HONEYWELL INTERNATIONAL INC
Supplemental Savings Plan Interests |
A - Award | 24 | 10.718 | 0,22 | 101,63 | 2.423 | 1.089.314 | |
| 2014-12-16 |
|
4 | HON |
HONEYWELL INTERNATIONAL INC
Supplemental Savings Plan Interests |
A - Award | 25 | 10.695 | 0,24 | 95,88 | 2.423 | 1.025.397 | |
| 2014-12-01 |
|
4 | HON |
HONEYWELL INTERNATIONAL INC
Supplemental Savings Plan Interests |
A - Award | 24 | 10.669 | 0,23 | 99,07 | 2.423 | 1.057.009 | |
| 2014-11-17 |
|
4 | HON |
HONEYWELL INTERNATIONAL INC
Supplemental Savings Plan Interests |
A - Award | 25 | 10.588 | 0,24 | 96,79 | 2.423 | 1.024.839 | |
| 2014-11-03 |
|
4 | HON |
HONEYWELL INTERNATIONAL INC
Supplemental Savings Plan Interests |
A - Award | 20 | 10.563 | 0,19 | 96,12 | 1.898 | 1.015.338 | |
| 2014-10-24 |
|
4 | HON |
HONEYWELL INTERNATIONAL INC
Common Stock |
S - Sale | -88.677 | 138.432 | -39,05 | 93,84 | -8.321.450 | 12.990.459 | |
| 2014-10-20 |
|
4 | HON |
HONEYWELL INTERNATIONAL INC
Supplemental Savings Plan Interests |
A - Award | 20 | 10.543 | 0,19 | 90,06 | 1.823 | 949.547 | |
| 2014-10-08 |
|
4 | HON |
HONEYWELL INTERNATIONAL INC
Restricted Units |
M - Exercise | -85.485 | 0 | -100,00 | 90,55 | -7.740.667 | ||
| 2014-10-08 |
|
4 | HON |
HONEYWELL INTERNATIONAL INC
Common Stock |
F - Taxes | -44.086 | 227.110 | -16,26 | 90,55 | -3.991.987 | 20.564.810 | |
| 2014-10-08 |
|
4 | HON |
HONEYWELL INTERNATIONAL INC
Common Stock |
M - Exercise | 85.485 | 271.196 | 46,03 | 90,55 | 7.740.667 | 24.556.798 | |
| 2014-10-06 |
|
4 | HON |
HONEYWELL INTERNATIONAL INC
Supplemental Savings Plan Interests |
A - Award | 20 | 10.523 | 0,19 | 91,71 | 1.823 | 965.087 | |
| 2014-09-22 |
|
4 | HON |
HONEYWELL INTERNATIONAL INC
Supplemental Savings Plan Interests |
A - Award | 19 | 10.503 | 0,18 | 96,50 | 1.823 | 1.013.575 | |
| 2014-09-09 |
|
4 | HON |
HONEYWELL INTERNATIONAL INC
Supplemental Savings Plan Interests |
A - Award | 19 | 10.484 | 0,18 | 95,61 | 1.823 | 1.002.421 | |
| 2014-08-25 |
|
4 | HON |
HONEYWELL INTERNATIONAL INC
Supplemental Savings Plan Interests |
A - Award | 19 | 10.465 | 0,18 | 95,56 | 1.823 | 1.000.074 | |
| 2014-08-19 |
|
4 | HON |
HONEYWELL INTERNATIONAL INC
Common Stock |
S - Sale | -90.000 | 185.711 | -32,64 | 95,03 | -8.552.700 | 17.648.116 | |
| 2014-08-11 |
|
4 | HON |
HONEYWELL INTERNATIONAL INC
Supplemental Savings Plan Interests |
A - Award | 20 | 10.397 | 0,19 | 92,71 | 1.823 | 963.900 | |
| 2014-07-29 |
|
4 | HON |
HONEYWELL INTERNATIONAL INC
Restricted Stock Units |
A - Award | 26.000 | 26.000 | |||||
| 2014-07-28 |
|
4 | HON |
HONEYWELL INTERNATIONAL INC
Supplemental Savings Plan Interests |
A - Award | 19 | 10.377 | 0,18 | 95,76 | 1.823 | 993.727 | |
| 2014-07-14 |
|
4 | HON |
HONEYWELL INTERNATIONAL INC
Supplemental Savings Plan Interests |
A - Award | 19 | 10.358 | 0,19 | 94,90 | 1.823 | 982.996 | |
| 2014-07-01 |
|
4 | HON |
HONEYWELL INTERNATIONAL INC
Supplemental Savings Plan Interests |
A - Award | 20 | 10.339 | 0,19 | 93,26 | 1.823 | 964.217 | |
| 2014-06-16 |
|
4 | HON |
HONEYWELL INTERNATIONAL INC
Supplemental Savings Plan Interests |
A - Award | 19 | 10.319 | 0,19 | 93,77 | 1.823 | 967.657 | |
| 2014-06-03 |
|
4 | HON |
HONEYWELL INTERNATIONAL INC
Supplemental Savings Plan Interests |
A - Award | 20 | 10.300 | 0,19 | 93,15 | 1.823 | 959.448 | |
| 2014-05-19 |
|
4 | HON |
HONEYWELL INTERNATIONAL INC
Supplemental Savings Plan Interests |
A - Award | 20 | 10.230 | 0,20 | 91,20 | 1.823 | 932.932 | |
| 2014-05-14 |
|
4 | PBI |
PITNEY BOWES INC /DE/
Restricted Stock Units |
A - Award | 3.816 | 3.816 | 26,21 | 100.017 | 100.017 | ||
| 2014-05-05 |
|
4 | HON |
HONEYWELL INTERNATIONAL INC
Supplemental Savings Plan Interests |
A - Award | 20 | 10.210 | 0,19 | 92,37 | 1.823 | 943.054 | |
| 2014-04-21 |
|
4 | HON |
HONEYWELL INTERNATIONAL INC
Supplemental Savings Plan Interests |
A - Award | 20 | 10.190 | 0,19 | 93,10 | 1.823 | 948.669 | |
| 2014-04-08 |
|
4 | HON |
HONEYWELL INTERNATIONAL INC
Supplemental Savings Plan Interests |
A - Award | 20 | 10.170 | 0,19 | 93,33 | 1.823 | 949.185 | |
| 2014-03-24 |
|
4 | HON |
HONEYWELL INTERNATIONAL INC
Supplemental Savings Plan Interests |
A - Award | 20 | 10.151 | 0,19 | 92,99 | 1.823 | 943.911 | |
| 2014-03-11 |
|
4 | HON |
HONEYWELL INTERNATIONAL INC
Supplemental Savings Plan Interests |
A - Award | 19 | 10.131 | 0,19 | 95,44 | 1.823 | 966.909 | |
| 2014-02-28 |
|
4 | HON |
HONEYWELL INTERNATIONAL INC
Employee Stock Options |
A - Award | 180.000 | 180.000 | |||||
| 2014-02-26 |
|
4 | HON |
HONEYWELL INTERNATIONAL INC
Stock Option (right to buy) |
M - Exercise | -71.321 | 0 | -100,00 | ||||
| 2014-02-26 |
|
4 | HON |
HONEYWELL INTERNATIONAL INC
Common Stock |
S - Sale | -54.032 | 275.711 | -16,39 | 95,00 | -5.133.040 | 26.192.545 | |
| 2014-02-26 |
|
4 | HON |
HONEYWELL INTERNATIONAL INC
Common Stock |
M - Exercise | 71.321 | 329.743 | 27,60 | 47,38 | 3.379.189 | 15.623.223 | |
| 2014-02-24 |
|
4 | HON |
HONEYWELL INTERNATIONAL INC
Supplemental Savings Plan Interests |
A - Award | 19 | 10.064 | 0,19 | 93,93 | 1.823 | 945.285 | |
| 2014-02-20 |
|
4 | HON |
HONEYWELL INTERNATIONAL INC
Stock Option (right to buy) |
M - Exercise | -16.179 | 71.321 | -18,49 | ||||
| 2014-02-20 |
|
4 | HON |
HONEYWELL INTERNATIONAL INC
Common Stock |
S - Sale | -12.257 | 258.422 | -4,53 | 95,00 | -1.164.415 | 24.550.090 | |
| 2014-02-20 |
|
4 | HON |
HONEYWELL INTERNATIONAL INC
Common Stock |
M - Exercise | 16.179 | 270.679 | 6,36 | 47,38 | 766.561 | 12.824.771 | |
| 2014-01-30 |
|
4 | HON |
HONEYWELL INTERNATIONAL INC
Stock Option (right to buy) |
M - Exercise | -87.500 | 87.500 | -50,00 | ||||
| 2014-01-30 |
|
4 | HON |
HONEYWELL INTERNATIONAL INC
Common Stock |
S - Sale | -67.477 | 254.500 | -20,96 | 90,23 | -6.088.450 | 22.963.535 | |
| 2014-01-30 |
|
4 | HON |
HONEYWELL INTERNATIONAL INC
Common Stock |
M - Exercise | 87.500 | 321.977 | 37,32 | 47,38 | 4.145.750 | 15.255.270 | |
| 2014-01-27 |
|
4 | HON |
HONEYWELL INTERNATIONAL INC
Supplemental Savings Plan Interests |
A - Award | 21 | 10.025 | 0,21 | 88,47 | 1.823 | 886.889 | |
| 2014-01-21 |
|
4 | MSM |
MSC INDUSTRIAL DIRECT CO INC
Class A Common Stock, $0.001 par value |
A - Award | 1.298 | 31.642 | 4,28 | ||||
| 2014-01-14 |
|
4 | HON |
HONEYWELL INTERNATIONAL INC
Supplemental Savings Plan Interests |
A - Award | 20 | 10.004 | 0,20 | 90,16 | 1.823 | 901.973 | |
| 2013-12-26 |
|
4 | HON |
HONEYWELL INTERNATIONAL INC
Common Stock |
S - Sale | X | -25.000 | 234.477 | -9,63 | 90,00 | -2.250.000 | 21.102.930 |
| 2013-12-16 |
|
4 | HON |
HONEYWELL INTERNATIONAL INC
Supplemental Savings Plan Interests |
A - Award | 26 | 9.959 | 0,26 | 86,61 | 2.276 | 862.544 | |
| 2013-12-02 |
|
4 | HON |
HONEYWELL INTERNATIONAL INC
Supplemental Savings Plan Interests |
A - Award | 26 | 9.933 | 0,26 | 88,51 | 2.276 | 879.140 | |
| 2013-11-18 |
|
4 | HON |
HONEYWELL INTERNATIONAL INC
Supplemental Savings Plan Interests |
A - Award | 24 | 9.856 | 0,24 | 88,62 | 2.097 | 873.480 | |
| 2013-11-04 |
|
4 | HON |
HONEYWELL INTERNATIONAL INC
Supplemental Savings Plan Interests |
A - Award | 21 | 9.833 | 0,22 | 86,91 | 1.835 | 854.569 | |
| 2013-10-22 |
|
4 | HON |
HONEYWELL INTERNATIONAL INC
Supplemental Savings Plan Interests |
A - Award | 22 | 9.812 | 0,22 | 84,58 | 1.835 | 829.873 | |
| 2013-10-15 |
|
4 | HON |
HONEYWELL INTERNATIONAL INC
Common Stock |
S - Sale | X | -12.897 | 259.477 | -4,74 | 85,02 | -1.096.503 | 22.060.735 |
| 2013-10-15 |
|
4 | HON |
HONEYWELL INTERNATIONAL INC
Stock Option (right to buy) |
M - Exercise | -244.421 | 0 | -100,00 | ||||
| 2013-10-15 |
|
4 | HON |
HONEYWELL INTERNATIONAL INC
Common Stock |
S - Sale | X | -177.715 | 272.374 | -39,48 | 85,00 | -15.105.775 | 23.151.790 |
| 2013-10-15 |
|
4 | HON |
HONEYWELL INTERNATIONAL INC
Common Stock |
M - Exercise | X | 244.421 | 450.089 | 118,84 | 28,35 | 6.929.335 | 12.760.023 |
| 2013-10-07 |
|
4 | HON |
HONEYWELL INTERNATIONAL INC
Supplemental Savings Plan Interests |
A - Award | 22 | 9.790 | 0,23 | 82,24 | 1.835 | 805.130 | |
| 2013-09-24 |
|
4 | HON |
HONEYWELL INTERNATIONAL INC
Stock Option (right to buy) |
M - Exercise | -30.579 | 244.421 | -11,12 | ||||
| 2013-09-24 |
|
4 | HON |
HONEYWELL INTERNATIONAL INC
Common Stock |
S - Sale | -20.711 | 88.236 | -19,01 | 85,14 | -1.763.335 | 7.512.413 | |
| 2013-09-24 |
|
4 | HON |
HONEYWELL INTERNATIONAL INC
Common Stock |
M - Exercise | 30.579 | 108.947 | 39,02 | 28,35 | 866.915 | 3.088.647 | |
| 2013-09-23 |
|
4 | HON |
HONEYWELL INTERNATIONAL INC
Supplemental Savings Plan Interests |
A - Award | 21 | 9.768 | 0,22 | 85,48 | 1.835 | 834.943 | |
| 2013-09-10 |
|
4 | HON |
HONEYWELL INTERNATIONAL INC
Supplemental Savings Plan Interests |
A - Award | 22 | 9.746 | 0,23 | 81,66 | 1.835 | 795.877 | |
| 2013-08-27 |
|
4 | HON |
HONEYWELL INTERNATIONAL INC
Supplemental Savings Plan Interests |
A - Award | 23 | 9.724 | 0,23 | 81,40 | 1.835 | 791.515 | |
| 2013-08-13 |
|
4 | HON |
HONEYWELL INTERNATIONAL INC
Supplemental Savings Plan Interests |
A - Award | 22 | 9.653 | 0,23 | 83,32 | 1.835 | 804.283 | |
| 2013-07-29 |
|
4 | HON |
HONEYWELL INTERNATIONAL INC
Supplemental Savings Plan Interests |
A - Award | 22 | 9.631 | 0,23 | 82,88 | 1.835 | 798.211 | |
| 2013-07-15 |
|
4 | HON |
HONEYWELL INTERNATIONAL INC
Supplemental Savings Plan Interests |
A - Award | 22 | 9.609 | 0,23 | 82,37 | 1.835 | 791.476 | |
| 2013-07-01 |
|
4 | HON |
HONEYWELL INTERNATIONAL INC
Supplemental Savings Plan Interests |
A - Award | 23 | 9.587 | 0,24 | 79,34 | 1.835 | 760.594 | |
| 2013-06-17 |
|
4 | HON |
HONEYWELL INTERNATIONAL INC
Supplemental Savings Plan Interests |
A - Award | 23 | 9.563 | 0,25 | 78,18 | 1.835 | 747.666 | |
| 2013-06-04 |
|
4 | HON |
HONEYWELL INTERNATIONAL INC
Supplemental Savings Plan Interests |
A - Award | 23 | 9.540 | 0,25 | 78,46 | 1.835 | 748.502 | |
| 2013-05-21 |
|
4 | HON |
HONEYWELL INTERNATIONAL INC
Stock Option (right to buy) |
M - Exercise | -175.000 | 0 | -100,00 | ||||
| 2013-05-21 |
|
4 | HON |
HONEYWELL INTERNATIONAL INC
Stock Option (right to buy) |
M - Exercise | -75.000 | 0 | -100,00 | ||||
| 2013-05-21 |
|
4 | HON |
HONEYWELL INTERNATIONAL INC
Common Stock |
S - Sale | -134.957 | 78.368 | -63,26 | 80,42 | -10.853.242 | 6.302.355 | |
| 2013-05-21 |
|
4 | HON |
HONEYWELL INTERNATIONAL INC
Common Stock |
M - Exercise | 175.000 | 213.325 | 456,62 | 42,32 | 7.406.000 | 9.027.914 | |
| 2013-05-21 |
|
4 | HON |
HONEYWELL INTERNATIONAL INC
Common Stock |
S - Sale | -55.284 | 38.325 | -59,06 | 80,00 | -4.422.720 | 3.066.000 | |
| 2013-05-21 |
|
4 | HON |
HONEYWELL INTERNATIONAL INC
Common Stock |
M - Exercise | X | 75.000 | 93.609 | 403,03 | 36,51 | 2.738.250 | 3.417.665 |
| 2013-05-20 |
|
4 | HON |
HONEYWELL INTERNATIONAL INC
Supplemental Savings Plan Interests |
A - Award | 23 | 9.517 | 0,24 | 80,75 | 1.835 | 768.460 | |
| 2013-05-14 |
|
4 | PBI |
PITNEY BOWES INC /DE/
Common Stock |
A - Award | 2.200 | 9.997 | 28,22 | 15,16 | 33.363 | 151.605 | |
| 2013-05-06 |
|
4 | HON |
HONEYWELL INTERNATIONAL INC
Supplemental Savings Plan Interests |
A - Award | 24 | 9.445 | 0,26 | 75,24 | 1.835 | 710.614 | |
| 2013-04-23 |
|
4 | HON |
HONEYWELL INTERNATIONAL INC
Supplemental Savings Plan Interests |
A - Award | 25 | 9.420 | 0,26 | 74,18 | 1.835 | 698.794 | |
| 2013-04-08 |
|
4 | HON |
HONEYWELL INTERNATIONAL INC
Supplemental Savings Plan Interests |
A - Award | 25 | 9.396 | 0,27 | 72,98 | 1.835 | 685.685 | |
| 2013-03-25 |
|
4 | HON |
HONEYWELL INTERNATIONAL INC
Stock Option (right to buy) |
M - Exercise | -75.000 | 75.000 | -50,00 | ||||
| 2013-03-25 |
|
4 | HON |
HONEYWELL INTERNATIONAL INC
Common Stock |
S - Sale | -56.392 | 18.609 | -75,19 | 75,00 | -4.229.400 | 1.395.675 | |
| 2013-03-25 |
|
4 | HON |
HONEYWELL INTERNATIONAL INC
Common Stock |
M - Exercise | X | 75.000 | 75.001 | 7.500.000,00 | 36,51 | 2.738.250 | 2.738.287 |
| 2013-03-25 |
|
4 | HON |
HONEYWELL INTERNATIONAL INC
Supplemental Savings Plan Interests |
A - Award | 24 | 9.370 | 0,26 | 75,19 | 1.835 | 704.559 | |
| 2013-03-12 |
|
4 | HON |
HONEYWELL INTERNATIONAL INC
Supplemental Savings Plan Interests |
A - Award | 25 | 9.346 | 0,27 | 73,70 | 1.835 | 688.799 | |
| 2013-02-28 |
|
4 | HON |
HONEYWELL INTERNATIONAL INC
Employee Stock Options |
A - Award | 225.000 | 225.000 | |||||
| 2013-02-25 |
|
4 | HON |
HONEYWELL INTERNATIONAL INC
Supplemental Savings Plan Interests |
A - Award | 26 | 9.321 | 0,28 | 69,89 | 1.835 | 651.451 | |
| 2013-02-11 |
|
4 | HON |
HONEYWELL INTERNATIONAL INC
Supplemental Savings Plan Interests |
A - Award | 26 | 9.241 | 0,28 | 70,53 | 1.835 | 651.736 | |
| 2013-02-06 |
|
4 | HON |
HONEYWELL INTERNATIONAL INC
Common Stock |
S - Sale | X | -50.000 | 1 | -100,00 | 70,00 | -3.500.000 | 70 |
| 2013-02-01 |
|
4 | HON |
HONEYWELL INTERNATIONAL INC
Common Stock |
S - Sale | X | -50.000 | 50.001 | -50,00 | 68,44 | -3.422.000 | 3.422.068 |
| 2013-01-29 |
|
4 | HON |
HONEYWELL INTERNATIONAL INC
Supplemental Savings Plan Interests |
A - Award | 27 | 9.215 | 0,29 | 68,33 | 1.835 | 629.630 | |
| 2013-01-22 |
|
4 | MSM |
MSC INDUSTRIAL DIRECT CO INC
Class A Common Stock, $0.001 par value |
A - Award | 1.506 | 30.344 | 5,22 | ||||
| 2013-01-15 |
|
4 | HON |
HONEYWELL INTERNATIONAL INC
Supplemental Savings Plan Interests |
A - Award | 28 | 9.188 | 0,30 | 66,31 | 1.835 | 609.236 | |
| 2013-01-02 |
|
4 | HON |
HONEYWELL INTERNATIONAL INC
Supplemental Savings Plan Interests |
A - Award | 36 | 9.160 | 0,40 | 62,92 | 2.279 | 576.349 | |
| 2012-12-18 |
|
4 | HON |
HONEYWELL INTERNATIONAL INC
Supplemental Savings Plan Interests |
A - Award | 37 | 9.124 | 0,41 | 61,55 | 2.279 | 561.571 | |
| 2012-12-03 |
|
4 | HON |
HONEYWELL INTERNATIONAL INC
Supplemental Savings Plan Interests |
A - Award | 37 | 9.087 | 0,41 | 61,33 | 2.279 | 557.293 | |
| 2012-11-19 |
|
4 | HON |
HONEYWELL INTERNATIONAL INC
Supplemental Savings Plan Interests |
A - Award | 38 | 9.050 | 0,42 | 59,15 | 2.221 | 535.285 | |
| 2012-11-05 |
|
4 | HON |
HONEYWELL INTERNATIONAL INC
Supplemental Savings Plan Interests |
A - Award | 30 | 8.950 | 0,33 | 62,43 | 1.846 | 558.751 | |
| 2012-11-05 |
|
4 | HON |
HONEYWELL INTERNATIONAL INC
Stock Option (right to buy) |
M - Exercise | -150.000 | 0 | -100,00 | ||||
| 2012-11-05 |
|
4 | HON |
HONEYWELL INTERNATIONAL INC
Common Stock |
S - Sale | -115.117 | 107.973 | -51,60 | 62,78 | -7.227.045 | 6.778.545 | |
| 2012-11-05 |
|
4 | HON |
HONEYWELL INTERNATIONAL INC
Common Stock |
M - Exercise | 150.000 | 223.090 | 205,23 | 35,65 | 5.347.500 | 7.953.158 | |
| 2012-10-22 |
|
4 | HON |
HONEYWELL INTERNATIONAL INC
Supplemental Savings Plan Interests |
A - Award | 30 | 8.920 | 0,33 | 62,49 | 1.846 | 557.440 | |
| 2012-10-09 |
|
4 | HON |
HONEYWELL INTERNATIONAL INC
Supplemental Savings Plan Interests |
A - Award | 30 | 8.891 | 0,34 | 61,43 | 1.846 | 546.170 | |
| 2012-09-24 |
|
4 | HON |
HONEYWELL INTERNATIONAL INC
Supplemental Savings Plan Interests |
A - Award | 31 | 8.861 | 0,35 | 60,52 | 1.846 | 536.260 | |
| 2012-09-10 |
|
4 | HON |
HONEYWELL INTERNATIONAL INC
Supplemental Savings Plan Interests |
A - Award | 31 | 8.830 | 0,35 | 59,90 | 1.846 | 528.939 | |
| 2012-08-27 |
|
4 | HON |
HONEYWELL INTERNATIONAL INC
Supplemental Savings Plan Interests |
A - Award | 32 | 8.800 | 0,36 | 58,36 | 1.846 | 513.542 | |
| 2012-08-14 |
|
4 | HON |
HONEYWELL INTERNATIONAL INC
Supplemental Savings Plan Interests |
A - Award | 31 | 8.713 | 0,36 | 59,01 | 1.846 | 514.135 | |
| 2012-07-31 |
|
4 | HON |
HONEYWELL INTERNATIONAL INC
Restricted Units |
M - Exercise | -17.000 | 0 | -100,00 | ||||
| 2012-07-31 |
|
4 | HON |
HONEYWELL INTERNATIONAL INC
Common Stock |
F - Taxes | -7.832 | 182.551 | -4,11 | 58,71 | -459.817 | 10.717.569 | |
| 2012-07-31 |
|
4 | HON |
HONEYWELL INTERNATIONAL INC
Common Stock |
M - Exercise | 17.000 | 190.383 | 9,80 | 58,71 | 998.070 | 11.177.386 | |
| 2012-07-31 |
|
4 | HON |
HONEYWELL INTERNATIONAL INC
Supplemental Savings Plan Interests |
A - Award | 31 | 8.681 | 0,36 | 59,01 | 1.846 | 512.289 | |
| 2012-07-31 |
|
4 | HON |
HONEYWELL INTERNATIONAL INC
Stock Option (right to buy) |
M - Exercise | -75.000 | 0 | -100,00 | ||||
| 2012-07-31 |
|
4 | HON |
HONEYWELL INTERNATIONAL INC
Common Stock |
S - Sale | -51.100 | 173.383 | -22,76 | 59,06 | -3.017.966 | 10.240.000 | |
| 2012-07-31 |
|
4 | HON |
HONEYWELL INTERNATIONAL INC
Common Stock |
M - Exercise | 75.000 | 224.483 | 50,17 | 23,93 | 1.794.750 | 5.371.878 | |
| 2012-07-27 |
|
4 | HON |
HONEYWELL INTERNATIONAL INC
Restricted Stock Units |
A - Award | 18.000 | 18.000 | |||||
| 2012-07-27 |
|
4 | HON |
HONEYWELL INTERNATIONAL INC
Restricted Stock Units |
A - Award | 35.000 | 35.000 | |||||
| 2012-07-16 |
|
4 | HON |
HONEYWELL INTERNATIONAL INC
Supplemental Savings Plan Interests |
A - Award | 34 | 8.650 | 0,39 | 54,58 | 1.846 | 472.123 | |
| 2012-07-02 |
|
4 | HON |
HONEYWELL INTERNATIONAL INC
Supplemental Savings Plan Interests |
A - Award | 28 | 8.616 | 0,32 | 55,84 | 1.538 | 481.133 | |
| 2012-06-18 |
|
4 | HON |
HONEYWELL INTERNATIONAL INC
Supplemental Savings Plan Interests |
A - Award | 27 | 8.589 | 0,32 | 56,04 | 1.538 | 481.313 | |
| 2012-06-04 |
|
4 | HON |
HONEYWELL INTERNATIONAL INC
Supplemental Savings Plan Interests |
A - Award | 29 | 8.561 | 0,33 | 53,94 | 1.538 | 461.795 | |
| 2012-05-21 |
|
4 | HON |
HONEYWELL INTERNATIONAL INC
Supplemental Savings Plan Interests |
A - Award | 28 | 8.533 | 0,33 | 55,23 | 1.538 | 471.264 | |
| 2012-05-15 |
|
4 | PBI |
PITNEY BOWES INC /DE/
Common Stock |
A - Award | 2.200 | 7.797 | 39,31 | 14,52 | 31.933 | 113.173 | |
| 2012-04-23 |
|
4 | HON |
HONEYWELL INTERNATIONAL INC
Supplemental Savings Plan Interests |
A - Award | 26 | 8.424 | 0,31 | 59,39 | 1.538 | 500.294 | |
| 2012-04-09 |
|
4 | HON |
HONEYWELL INTERNATIONAL INC
Supplemental Savings Plan Interests |
A - Award | 26 | 8.398 | 0,31 | 59,49 | 1.538 | 499.596 | |
| 2012-03-27 |
|
4 | HON |
HONEYWELL INTERNATIONAL INC
Supplemental Savings Plan Interests |
A - Award | 26 | 8.372 | 0,31 | 60,16 | 1.538 | 503.666 | |
| 2012-03-12 |
|
4 | HON |
HONEYWELL INTERNATIONAL INC
Supplemental Savings Plan Interests |
A - Award | 26 | 8.347 | 0,31 | 59,78 | 1.538 | 498.956 | |
| 2012-03-02 |
|
4 | HON |
HONEYWELL INTERNATIONAL INC
Employee Stock Options |
A - Award | 200.000 | 200.000 | |||||
| 2012-02-28 |
|
4 | HON |
HONEYWELL INTERNATIONAL INC
Restricted Units |
M - Exercise | -43.205 | 0 | -100,00 | 59,27 | -2.560.760 | ||
| 2012-02-28 |
|
4 | HON |
HONEYWELL INTERNATIONAL INC
Common Stock |
F - Taxes | -19.970 | 149.196 | -11,80 | 59,27 | -1.183.622 | 8.842.847 | |
| 2012-02-28 |
|
4 | HON |
HONEYWELL INTERNATIONAL INC
Common Stock |
M - Exercise | 43.205 | 169.166 | 34,30 | 59,27 | 2.560.760 | 10.026.469 | |
| 2012-02-27 |
|
4 | HON |
HONEYWELL INTERNATIONAL INC
Supplemental Savings Plan Interests |
A - Award | 26 | 8.321 | 0,31 | 59,27 | 1.538 | 493.174 | |
| 2012-02-13 |
|
4 | HON |
HONEYWELL INTERNATIONAL INC
Supplemental Savings Plan Interests |
A - Award | 26 | 8.243 | 0,32 | 59,33 | 1.538 | 489.046 | |
| 2012-02-02 |
|
4 | PBI |
PITNEY BOWES INC /DE/
Common Stock |
A - Award | 597 | 5.597 | 11,94 | 19,14 | 11.427 | 107.127 | |
| 2012-02-01 | 3 | PBI |
PITNEY BOWES INC /DE/
Common Stock |
5.000 | ||||||||
| 2012-01-30 |
|
4 | HON |
HONEYWELL INTERNATIONAL INC
Supplemental Savings Plan Interests |
A - Award | 26 | 8.217 | 0,32 | 58,27 | 1.538 | 478.797 | |
| 2012-01-17 |
|
4 | HON |
HONEYWELL INTERNATIONAL INC
Supplemental Savings Plan Interests |
A - Award | 27 | 8.190 | 0,33 | 56,70 | 1.538 | 464.400 | |
| 2012-01-13 |
|
4 | MSM |
MSC INDUSTRIAL DIRECT CO INC
Class A Common Stock, $0.001 par value |
A - Award | 1.562 | 28.838 | 5,73 | ||||
| 2012-01-03 |
|
4 | HON |
HONEYWELL INTERNATIONAL INC
Supplemental Savings Plan Interests |
A - Award | 35 | 8.163 | 0,43 | 54,35 | 1.901 | 443.678 | |
| 2006-05-22 |
|
4 | HON |
HONEYWELL INTERNATIONAL INC
Supplemental Savings Plan Interests |
A - Award | 32 | 1.301 | 2,49 | 41,92 | 1.323 | 54.548 | |
| 2004-01-15 | 3 | HON |
HONEYWELL INTERNATIONAL INC
Common Stock |
106.348 |
P
Piața deschisă sau achiziția privată de titluri nederivate sau derivate
S
Piața deschisă sau vânzarea privată a titlurilor de valoare nederivate sau derivate
A
Acordarea, atribuirea sau alte achiziții de valori mobiliare de la companie (cum ar fi o opțiune)
C
Conversia derivatei
D
Vânzarea sau transferul de valori mobiliare înapoi către companie
F
Plata prețului de exercițiu sau a obligației fiscale folosind o parte din titlurile de valoare primite de la companie
G
Donarea de valori mobiliare de către sau către persoane din interior
K
Swap-uri de acțiuni și tranzacții similare de acoperire împotriva riscurilor
M
Exercitarea sau conversia titlurilor derivate primite de la companie (cum ar fi o opțiune)
V
O tranzacție raportată voluntar pe Formularul 4
J
Altele (însoțite de o notă de subsol care descrie tranzacția)