Statistici de bază
| Valoarea portofoliului | $ 759.083.048 |
| Poziții curente | 80 |
Ultimele participații, performanță, AUM (de la 13F, 13D)
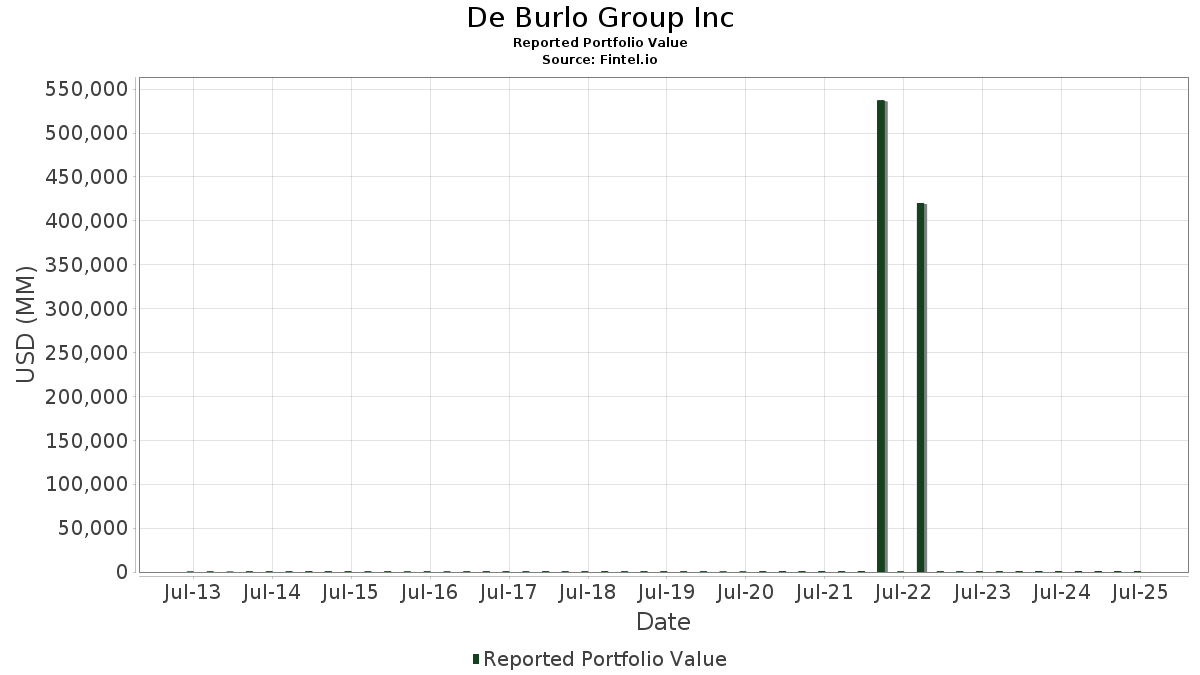
De Burlo Group Inc a dezvăluit un total de 80 participații în cele mai recente dosare la SEC. Valoarea cea mai recentă a portofoliului este calculată la 759.083.048 USD. Activele reale în gestiune (AUM) reprezintă această valoare plus numerar (care nu este dezvăluit). Cele mai importante acțiuni ale lui De Burlo Group Inc sunt Microsoft Corporation (US:MSFT) , Meta Platforms, Inc. (US:META) , Netflix, Inc. (US:NFLX) , Amazon.com, Inc. (US:AMZN) , and Broadcom Inc. (US:AVGO) . Noile poziții ale lui De Burlo Group Inc includ MercadoLibre, Inc. (US:MELI) , iShares Trust - iShares MSCI India ETF (US:INDA) , .
Creșteri de top în acest trimestru
Folosim modificarea alocării portofoliului deoarece aceasta este cea mai semnificativă măsură. Modificările se pot datora tranzacțiilor sau modificărilor prețurilor acțiunilor.
| Securitate | Acțiuni (MM) |
Valoare (MM$) |
portofoliu % | Δportofoliu % |
|---|---|---|---|---|
| 0,21 | 32,61 | 4,2964 | 4,2964 | |
| 0,09 | 42,68 | 5,6222 | 2,3058 | |
| 0,03 | 37,99 | 5,0042 | 1,7204 | |
| 0,08 | 24,15 | 3,1811 | 1,6932 | |
| 0,00 | 12,81 | 1,6871 | 1,6871 | |
| 0,35 | 20,96 | 2,7616 | 1,5106 | |
| 0,01 | 10,83 | 1,4263 | 1,4263 | |
| 0,04 | 10,82 | 1,4249 | 1,4249 | |
| 0,12 | 32,78 | 4,3179 | 1,1945 | |
| 0,07 | 12,16 | 1,6022 | 0,8395 |
Top Scăderi în acest trimestru
Folosim modificarea alocării portofoliului deoarece aceasta este cea mai semnificativă măsură. Modificările se pot datora tranzacțiilor sau modificărilor prețurilor acțiunilor.
| Securitate | Acțiuni (MM) |
Valoare (MM$) |
portofoliu % | Δportofoliu % |
|---|---|---|---|---|
| 0,15 | 18,16 | 2,3923 | -1,7931 | |
| 0,33 | 29,61 | 3,9005 | -1,7848 | |
| 0,03 | 4,91 | 0,6470 | -1,4271 | |
| 0,10 | 6,92 | 0,9122 | -1,3759 | |
| 0,06 | 27,49 | 3,6218 | -1,3633 | |
| 0,03 | 22,24 | 2,9296 | -0,9953 | |
| 0,14 | 28,42 | 3,7433 | -0,9221 | |
| 0,15 | 17,35 | 2,2859 | -0,9158 | |
| 0,17 | 36,56 | 4,8158 | -0,8231 | |
| 0,06 | 9,72 | 1,2799 | -0,7539 |
13F și dosarele de fond
Acest formular a fost depus pe 2025-08-13 pentru perioada de raportare 2025-06-30. Faceți clic pe pictograma linkului pentru a vedea istoricul complet al tranzacțiilor.
Faceți upgrade pentru a debloca datele premium și a le exporta în Excel ![]() .
.
| Securitate | Tip | Prețul mediu al acțiunii | Acțiuni (MM) |
ΔCotări (%) |
ΔCotări (%) |
Valoare ($ MM) |
Portofoliu (%) |
ΔPortofoliu (%) |
|
|---|---|---|---|---|---|---|---|---|---|
| MSFT / Microsoft Corporation | 0,09 | 43,38 | 42,68 | 90,00 | 5,6222 | 2,3058 | |||
| META / Meta Platforms, Inc. | 0,05 | 0,08 | 38,56 | 28,16 | 5,0795 | 0,6377 | |||
| NFLX / Netflix, Inc. | 0,03 | 18,93 | 37,99 | 70,79 | 5,0042 | 1,7204 | |||
| AMZN / Amazon.com, Inc. | 0,17 | -17,00 | 36,56 | -4,29 | 4,8158 | -0,8231 | |||
| AVGO / Broadcom Inc. | 0,12 | -5,90 | 32,78 | 54,93 | 4,3179 | 1,1945 | |||
| NVDA / NVIDIA Corporation | 0,21 | 32,61 | 4,2964 | 4,2964 | |||||
| ASML / ASML Holding N.V. - Depositary Receipt (Common Stock) | 0,04 | 13,65 | 31,75 | 37,46 | 4,1828 | 0,7725 | |||
| ORLY / O'Reilly Automotive, Inc. | 0,33 | 1.122,10 | 29,61 | -23,11 | 3,9005 | -1,7848 | |||
| AAPL / Apple Inc. | 0,14 | -2,65 | 28,42 | -10,08 | 3,7433 | -0,9221 | |||
| BRK.B / Berkshire Hathaway Inc. | 0,06 | -10,73 | 27,49 | -18,58 | 3,6218 | -1,3633 | |||
| ADSK / Autodesk, Inc. | 0,08 | 102,63 | 24,15 | 139,62 | 3,1811 | 1,6932 | |||
| LLY / Eli Lilly and Company | 0,03 | -11,37 | 22,24 | -16,35 | 2,9296 | -0,9953 | |||
| VRTX / Vertex Pharmaceuticals Incorporated | 0,05 | 0,06 | 21,71 | -8,11 | 2,8601 | -0,6283 | |||
| IEMG / iShares, Inc. - iShares Core MSCI Emerging Markets ETF | 0,35 | 122,42 | 20,96 | 147,40 | 2,7616 | 1,5106 | |||
| GS / The Goldman Sachs Group, Inc. | 0,03 | -31,62 | 19,75 | -11,41 | 2,6013 | -0,6894 | |||
| COST / Costco Wholesale Corporation | 0,02 | 0,37 | 19,55 | 5,06 | 2,5754 | -0,1719 | |||
| BKNG / Booking Holdings Inc. | 0,00 | 9,77 | 19,51 | 37,94 | 2,5702 | 0,4821 | |||
| ISRG / Intuitive Surgical, Inc. | 0,04 | 0,00 | 19,51 | 9,72 | 2,5700 | -0,0551 | |||
| KKR / KKR & Co. Inc. | 0,14 | -19,06 | 18,98 | -6,86 | 2,5008 | -0,5084 | |||
| MU / Micron Technology, Inc. | 0,15 | -54,84 | 18,16 | -35,94 | 2,3923 | -1,7931 | |||
| TT / Trane Technologies plc | 0,04 | 0,00 | 17,91 | 29,83 | 2,3597 | 0,3227 | |||
| BABA / Alibaba Group Holding Limited - Depositary Receipt (Common Stock) | 0,15 | -6,71 | 17,35 | -19,99 | 2,2859 | -0,9158 | |||
| MELI / MercadoLibre, Inc. | 0,00 | 12,81 | 1,6871 | 1,6871 | |||||
| GOOGL / Alphabet Inc. | 0,07 | 106,57 | 12,16 | 135,42 | 1,6022 | 0,8395 | |||
| MCK / McKesson Corporation | 0,01 | 10,83 | 1,4263 | 1,4263 | |||||
| RSG / Republic Services, Inc. | 0,04 | 10,82 | 1,4249 | 1,4249 | |||||
| GWW / W.W. Grainger, Inc. | 0,01 | 76,58 | 9,88 | 85,96 | 1,3019 | 0,5172 | |||
| BX / Blackstone Inc. | 0,06 | -34,09 | 9,72 | -29,47 | 1,2799 | -0,7539 | |||
| V / Visa Inc. | 0,02 | -2,08 | 8,28 | -0,79 | 1,0911 | -0,1415 | |||
| MA / Mastercard Incorporated | 0,01 | -2,55 | 7,73 | -0,10 | 1,0180 | -0,1240 | |||
| SWK / Stanley Black & Decker, Inc. | 0,10 | -49,30 | 6,92 | -55,32 | 0,9122 | -1,3759 | |||
| IR / Ingersoll Rand Inc. | 0,08 | -23,32 | 6,75 | -20,31 | 0,8898 | -0,3615 | |||
| ONON / On Holding AG | 0,13 | -36,06 | 6,64 | -24,22 | 0,8743 | -0,4187 | |||
| ABBV / AbbVie Inc. | 0,03 | -2,69 | 4,99 | -13,81 | 0,6572 | -0,1972 | |||
| AMD / Advanced Micro Devices, Inc. | 0,03 | -74,69 | 4,91 | -65,04 | 0,6470 | -1,4271 | |||
| ETN / Eaton Corporation plc | 0,01 | -32,94 | 4,87 | -11,94 | 0,6415 | -0,1748 | |||
| AMP / Ameriprise Financial, Inc. | 0,01 | 0,00 | 4,58 | 10,25 | 0,6040 | -0,0100 | |||
| NOW / ServiceNow, Inc. | 0,00 | -26,27 | 4,47 | -4,79 | 0,5892 | -0,1043 | |||
| DHR / Danaher Corporation | 0,02 | -1,80 | 4,37 | -5,35 | 0,5754 | -0,1061 | |||
| TMO / Thermo Fisher Scientific Inc. | 0,01 | -1,97 | 4,33 | -20,12 | 0,5707 | -0,2300 | |||
| CRM / Salesforce, Inc. | 0,01 | -9,55 | 3,60 | -8,08 | 0,4749 | -0,1041 | |||
| ADBE / Adobe Inc. | 0,01 | -3,94 | 3,49 | -3,11 | 0,4597 | -0,0720 | |||
| INDA / iShares Trust - iShares MSCI India ETF | 0,05 | 3,01 | 0,3961 | 0,3961 | |||||
| JPM / JPMorgan Chase & Co. | 0,01 | -1,35 | 2,76 | 16,58 | 0,3631 | 0,0141 | |||
| CHD / Church & Dwight Co., Inc. | 0,03 | -2,22 | 2,76 | -14,62 | 0,3631 | -0,1136 | |||
| AMT / American Tower Corporation | 0,01 | -3,48 | 2,45 | -1,96 | 0,3232 | -0,0463 | |||
| INTU / Intuit Inc. | 0,00 | -1,94 | 2,39 | 25,80 | 0,3154 | 0,0344 | |||
| PG / The Procter & Gamble Company | 0,01 | -2,80 | 2,36 | -9,14 | 0,3103 | -0,0724 | |||
| PANW / Palo Alto Networks, Inc. | 0,01 | -2,85 | 2,19 | 16,46 | 0,2890 | 0,0110 | |||
| EW / Edwards Lifesciences Corporation | 0,02 | 0,62 | 1,48 | 8,59 | 0,1949 | -0,0063 | |||
| ANET / Arista Networks Inc | 0,01 | -0,72 | 1,41 | 31,05 | 0,1864 | 0,0271 | |||
| MASI / Masimo Corporation | 0,01 | -3,57 | 1,36 | -2,64 | 0,1795 | -0,0271 | |||
| SYK / Stryker Corporation | 0,00 | -6,22 | 1,19 | -0,25 | 0,1573 | -0,0196 | |||
| ABT / Abbott Laboratories | 0,01 | -1,74 | 1,15 | 0,70 | 0,1520 | -0,0171 | |||
| MAS / Masco Corporation | 0,02 | -7,77 | 1,15 | -14,68 | 0,1509 | -0,0472 | |||
| AWK / American Water Works Company, Inc. | 0,01 | 0,00 | 0,99 | -5,73 | 0,1303 | -0,0245 | |||
| ADP / Automatic Data Processing, Inc. | 0,00 | 0,00 | 0,89 | 0,91 | 0,1173 | -0,0129 | |||
| ATO / Atmos Energy Corporation | 0,01 | -18,60 | 0,83 | -18,78 | 0,1088 | -0,0415 | |||
| AZN / AstraZeneca PLC - Depositary Receipt (Common Stock) | 0,01 | -8,04 | 0,81 | -12,59 | 0,1070 | -0,0302 | |||
| STE / STERIS plc | 0,00 | -0,90 | 0,80 | 5,01 | 0,1051 | -0,0070 | |||
| SHW / The Sherwin-Williams Company | 0,00 | 0,00 | 0,75 | -1,71 | 0,0984 | -0,0137 | |||
| RGA / Reinsurance Group of America, Incorporated | 0,00 | 0,00 | 0,68 | 0,74 | 0,0893 | -0,0100 | |||
| GILD / Gilead Sciences, Inc. | 0,01 | -14,10 | 0,67 | -15,04 | 0,0886 | -0,0282 | |||
| GIS / General Mills, Inc. | 0,01 | 0,00 | 0,61 | -13,33 | 0,0805 | -0,0236 | |||
| NBIX / Neurocrine Biosciences, Inc. | 0,00 | -1,06 | 0,59 | 12,48 | 0,0773 | 0,0003 | |||
| CI / The Cigna Group | 0,00 | -8,76 | 0,58 | -8,36 | 0,0766 | -0,0171 | |||
| HD / The Home Depot, Inc. | 0,00 | -16,31 | 0,56 | -16,20 | 0,0743 | -0,0252 | |||
| BLD / TopBuild Corp. | 0,00 | -6,42 | 0,56 | -0,71 | 0,0740 | -0,0095 | |||
| ECL / Ecolab Inc. | 0,00 | -2,50 | 0,53 | 3,55 | 0,0692 | -0,0056 | |||
| VLTO / Veralto Corporation | 0,00 | -3,12 | 0,44 | 0,23 | 0,0582 | -0,0068 | |||
| LIN / Linde plc | 0,00 | 0,00 | 0,38 | 0,79 | 0,0507 | -0,0057 | |||
| LPLA / LPL Financial Holdings Inc. | 0,00 | 0,00 | 0,37 | 14,37 | 0,0494 | 0,0011 | |||
| FSLR / First Solar, Inc. | 0,00 | 0,00 | 0,33 | 31,35 | 0,0436 | 0,0063 | |||
| NEE / NextEra Energy, Inc. | 0,00 | 0,00 | 0,31 | -2,19 | 0,0412 | -0,0059 | |||
| ITW / Illinois Tool Works Inc. | 0,00 | 0,09 | 0,29 | -0,35 | 0,0379 | -0,0047 | |||
| FI / Fiserv, Inc. | 0,00 | 0,00 | 0,27 | -22,03 | 0,0355 | -0,0155 | |||
| UNP / Union Pacific Corporation | 0,00 | 0,00 | 0,22 | -2,64 | 0,0292 | -0,0044 | |||
| JNJ / Johnson & Johnson | 0,00 | 0,00 | 0,20 | -8,14 | 0,0268 | -0,0058 | |||
| BAC / Bank of America Corporation | 0,00 | 0,20 | 0,0265 | 0,0265 | |||||
| IART / Integra LifeSciences Holdings Corporation | 0,01 | 0,00 | 0,18 | -44,34 | 0,0234 | -0,0236 | |||
| UNH / UnitedHealth Group Incorporated | 0,00 | -100,00 | 0,00 | -100,00 | -0,5490 | ||||
| KRE / SPDR Series Trust - SPDR S&P Regional Banking ETF | 0,00 | -100,00 | 0,00 | 0,0000 | |||||
| IWM / iShares Trust - iShares Russell 2000 ETF | 0,00 | -100,00 | 0,00 | 0,0000 |